
Page 17 - May 2017
P. 17
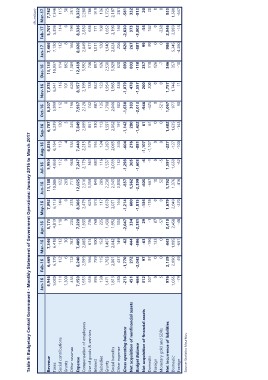
Table 9: Budgetary Central Government - Monthly Statement of Government Operations: January 2016 to March 2017

                                                                                                                                                                      (Rs million)

                                        Jan-16 Feb-16 Mar-16 Apr-16 May-16         Jun-16      Jul-16 Aug-16  Sep-16       Oct-16 Nov-16  Dec-16       Jan-17 Feb-17 Mar-17

Revenue                                 6,946   6,469    7,346   5,173    7,092      11,188    5,950 6,836       6,707     6,307 7,078      13,133     7,406 5,707 7,742
Taxes                                   5,080   6,179    6,418   4,819    6,713       10,086                      6,239                      10,937
Social contributions                                                                           4,869 6,164                 5,999 6,241                 7,120 5,393 7,346
Grants                                    111     112      112     110      144           122                       120                          114
Other revenue                           1,300         6      30        9        0         269  112 113                  3  112 116               892   112 114 115
Expense                                                                                   711                                                 1,189
Compensation of employees                  455     172     787     235      235      12,025    04                   345    0 101            12,439     8 0 30
Use of goods & services                                                                2,316                     7,849                        3,592
Interest                                                                               1,158   968 555            2,099    196 620               746   166 199 251
Subsidies                                                                                 849                                                    897
Grants                                  7,159   8,240    7,409   7,220    8,306           289  7,247 7,440          851    7,937 8,157           126   8,026 8,336 8,322
Social benefits                         1,953   2,599    2,085   1,935    2,479        2,238                        930                       2,530
Other expense                                                                          2,345   2,179 2,215          113    2,128 2,199        3,929    2,049 2,830 2,288
Gross operating balance                    656     566      674     736      625       2,830                      1,597                          620
Net acquisition of nonfinancial assets    896     759      900     768      973         -837   361 579            2,062    742 738              693    677 636 786
Budget Balance                            139     115      152     225      117        1,562                        197                         803
Net acquisition of financial assets     1,471   1,763    1,407   1,430    1,878      -2,399    883 955          -1,142     887 822             -110    1,011 771 919
Domestic                                1,813   2,001    2,042   1,992    2,071         -605                        280                         237
Foreign                                    230     437      149    133      164         -667   116 124          -1,422     125 123               118   120 108 136
Monetary gold and SDRs                                                                                                61                         126
Net incurrence of liabilities                                                              10  1,537 1,263                 1,708 1,954                 1,940 1,652 1,725
Domestic                                                                                   52                         61                           -7
Foreign                                                                                1,792   2,039 2,065              0  2,046 1,983          346    2,024 2,190 2,187
                                                                                       1,376                            0                        357
                                                                                          416  132 240                     302 338               -10   206 150 281
                                                                                                                 1,482
                                        -213 -1,770      -62 -2,047 -1,214                     -1,298 -604        1,625    -1,630 -1,079               -620 -2,630 -581
                                                                                                                   -143
                                        451 272 444 334 600                                    305 276                     383 478                     267 373 332

                                        -664 -2,043 -506 -2,381 -1,815                         -1,603 -881                 -2,013 -1,557               -887 -3,002 -913

                                        312 97 -63 29 -136                                     -6 -1,107                   -946  200                   99 -56         20

                                        307 97 -196 -1 -136                                    -1 -1,107                   -425  200                   99 182         20

                                        0       0 133            87       0                    00                          00                          000

                                        5 0 0 -57 0                                            -5 0                        -521  0                     0 -238         0

                                         976    2,139     443    2,410    1,679                1,597 -227                  1,067 1,757                 986 2,946 933
                                        1,055   2,090    1,095   2,458    2,049
                                                          -651             -370                1,659  -127                 977 1,746                    5,345  2,959  1,580
                                          -79       49              -48                          -62  -100                  90 11                      -4,360    -13   -647

Source: Statistics Mauritius.