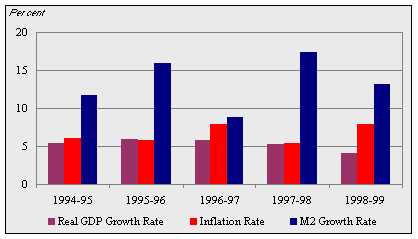
The basic thrust of monetary policy in 1998-99 was directed towards achieving price stability and maintaining a stable exchange rate of the rupee. In this regard, the Bank of Mauritius continued to employ its Reserve Money Programme and liquidity forecasting framework as a basis for intervention on the money and foreign exchange markets. The inflation rate was contained within the target of 8.0 per cent and money supply M2 grew by 13.2 per cent, down from 17.4 per cent in 1997-98.
The fiscal factor exerted considerable influence on monetary developments in 1998-99. Commercial banks' disinvestment from Treasury Bills in the wake of the reduction of the non-cash liquid assets ratio from 20 per cent to zero per cent in July 1997 shifted the burden of deficit financing to the central bank. Around 58 per cent of the deficit was financed by the central bank.
The rise in central bank claims on Government was reflected in higher levels of reserve money. The impact of the resulting increase in reserve money on money supply, on the exchange rate of the rupee and, ultimately, on the price level, was somehow dampened by higher yields on Treasury Bills. In addition, as from 14 December 1998, the Bank of Mauritius started to carry out regular sales of Treasury Bills over the counter to individuals and non-financial corporations with a view to curtailing excessive credit expansion with potential adverse effects on the soundness of the banking sector. The immediate effect of this shift in policy approach was to stabilise the exchange rate of the rupee and impart greater confidence to the interbank foreign exchange market. Steps were also taken to curtail the aggressive bidding tactics adopted by some banks on the foreign exchange market, the effect of which, combined with the regained confidence in the rupee's exchange rate, was to induce certain holdings of foreign exchange abroad to start getting repatriated.
|
BOX 1 Monetary Policy: 1998-99
During the fiscal year 1997-98, the monetary policy framework adopted by the Bank enabled the containment of the rate of inflation to below 6 per cent. For the fiscal year ended 30 June 1999, the Bank of Mauritius targeted an inflation rate of 8 per cent. 2. In 1998-99, four main factors were expected to have had an adverse impact on the price level in the economy: (i) the high rate of monetary expansion due largely to the high rate of domestic credit expansion in 1997-98; (ii) the introduction of the value-added tax in September 1998; (iii) the increase in wages and salaries in the public sector; and (iv) the inflation differential with our major trading partner countries. 3. The impact of price increases stemming from the introduction of the value-added tax was expected to even out in the short-term. The impact on monetary expansion of the substantial increase in wages and salaries was also reckoned. The basic thrust of monetary policy during 1998-99 remained, therefore, the containment of inflationary pressures due mainly to higher levels of aggregate demand. While pursuing its anti-inflationary monetary policy, however, the Bank maintained its policy of financial liberalisation. 4. The cash ratio was reduced to 5.5 per cent of total deposits with effect from the first monitoring week of July 1998, that is, the week ended 9 July 1998. In calculating the cash ratio, deposits denominated in all currencies were taken into account. Banks were also required to submit the weekly returns on cash ratio on rupee and foreign currency deposits separately. 5. To promote the development of an interbank market for Government papers, the Bank decided to introduce Repo transactions in Treasury Bills. This measure is expected to provide banks with a suitable mechanism for more efficient liquidity and risk management. Once the Master Agreement for the repo system is finalised, the terms and conditions governing transactions on the repo market and the date of implementation would be communicated to banks. 6. As from July 1998, an additional Treasury Bill with a maturity of two years was introduced with a view to providing banks, non-bank institutions and the public with a longer term investment instrument. 7. The Mauritius Sugar Syndicate started selling as from July 1997 its foreign currency receipts from sugar exports directly on the interbank foreign exchange market to give a boost to activities on that market. Most banks adapted themselves successfully to the new mechanism in the management of their trading in foreign currencies. Some banks appear to still rely on the central bank as a provider of their foreign exchange for their day-to-day requirements. 8. The scope for offshore banks to trade foreign currencies on the interbank foreign exchange market was created by permitting them to invest the rupee counterpart of any sale of foreign currencies in Government of Mauritius Treasury Bills. 9. Day-to-day determination of the exchange rates of the rupee was not always efficiently reflected in the indicative opening rates of banks. As these rates set the direction of the market, this issue needs to be addressed firmly to avoid distortion in the market, and their implications in terms of market development. 10. In terms of foreign exchange risk management, it is considered sound business and financial practice for a bank to establish written policies, which provide for a statement of principles and objectives governing the extent to which it is willing to assume foreign exchange risks, including limits on its exposure. Banks are required to clearly define the levels of authority within their organisations to trade in foreign exchange, and implement management information systems to control such risks. This policy must be approved by each bank’s board of directors, which should undertake to review it periodically. In this context, banks are required to comply with 15 per cent limit of their overall foreign exchange exposure in relation to their core capital. 11. In its capacity as supervisor, the Bank of Mauritius expects banks to carefully assess the purposes for which a loan or line of credit is requested by a customer, may that be a commercial enterprise, foreign bank or any other financial institution. In addition to the usual risk assessment, the amount of credit granted must be in appropriate relationship to the stated purpose. 12. Confidence in the financial system depends on the soundness of the financial institutions. It is therefore necessary that banks adopt and promote principles of good corporate governance and further enhance transparency and confidence in the system. Banks are accordingly required to publish six-monthly audited accounts with effect from the accounting year starting in 1999 in addition to the publication of the annual audited financial statements. The Mauritius Code of Banking Practice should be made available by all banks to their respective customers in order to assist customers understand the nature of their transactions and dealings with banks. Further, banks are due to have completed their Y2K compliance programme by 30 June 1999. The related Contingency Plan is scheduled to have been put in place by 30 September 1999. |
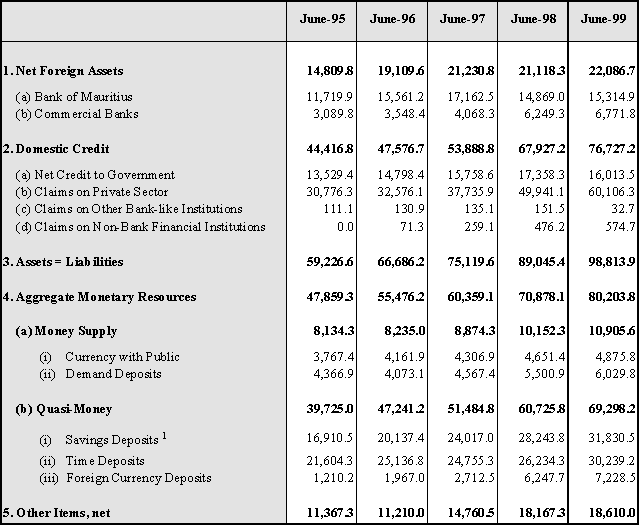
Net foreign assets of the banking system went up from Rs21,118 million at the end of June 1998 to Rs22,087 million at the end of June 1999, or by 4.6 per cent, as against a drop of 0.5 per cent in 1997-98. The net foreign assets of the Bank of Mauritius went up from Rs14,869 million as at end-June 1998 to Rs15,315 million as at end-June 1999, or by 3.0 per cent, in contrast to the decline of 13.4 per cent in 1997-98. This increase occurred in spite of interventions by the Bank of Mauritius to supplement sale of foreign exchange by the Mauritius Sugar Syndicate (MSS) and the partial redemption of the Floating Rate Note (FRN) for an amount of Rs808 million (US$33 million) during the year ended June 1999. The net foreign assets of commercial banks went up from Rs6,249 million as at end-June 1998 to Rs6,772 million as at end-June 1999, representing an increase of 8.4 per cent, as compared to a much larger expansion of 53.6 per cent in 1997-98.
Chart III.1: Real GDP Growth Rate, Inflation Rate and M2 Growth Rate

Total domestic credit rose by 13.0 per cent in 1998-99 as compared to an increase of 26.1 per cent in 1997-98. The rise was largely due to an increase of 20.4 per cent in credit to the private sector that was partly offset by a drop of 7.7 per cent in net credit to Government. In absolute terms, domestic credit went up by Rs8,800 million from Rs67,927 million at the end of June 1998 to Rs76,727 million at the end of June 1999.
Table III.1: Monetary Survey
(Rs million)
1
Include margin deposits.Figures may not add up to totals due to rounding.
For the first time in four years, there was a decline in net credit to Government, which fell by Rs1,345 million or 7.7 per cent, to Rs16,014 million at the end of June 1999 as against an increase of 10.2 per cent in 1997-98. Claims on Government by commercial banks fell by Rs3,468 million, from Rs14,905 million at the end of June 1998 to Rs11,437 million at the end of June 1999, or by 23.3 per cent, as compared to a slight decline of 0.3 per cent in the preceding year. Net credit to Government by the Bank of Mauritius over the same period increased by Rs2,124 million, from Rs2,453 million to Rs4,577 million, or by 86.6 per cent, partly offsetting the decline in commercial bank credit to the Government. About 80 per cent of the increase in central bank credit to Government as at end-June 1999 was in the form of direct advances, up from around 69 per cent as at end-June 1998.
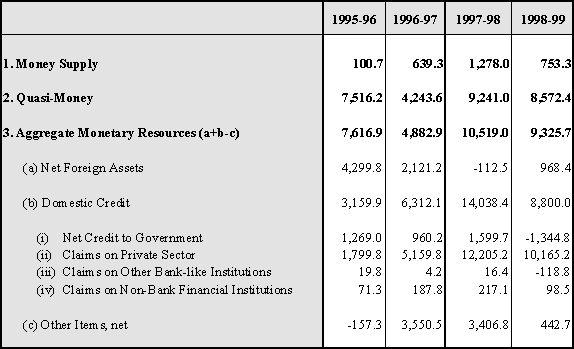
Table III.2: Changes in Monetary Aggregates
(Rs million)
Figures may not add up to totals due to rounding.
Commercial bank credit to the private sector grew by Rs10,165 million, from Rs49,941 million at the end of June 1998 to Rs60,106 million at the end of June 1999, or by 20.4 per cent. In the preceding fiscal year, private sector credit increased by 32.3 per cent. Loans and advances expanded by Rs7,228 million, from Rs40,720 million at the end of June 1998 to Rs47,948 million at the end of June 1999 while credit by way of investment in tax-free debentures of the private sector increased by Rs3,012 million, from Rs6,397 million to Rs9,409 million over the same period. In 1997-98, commercial banks' additional investment in tax-free debentures amounted to Rs5,734 million, exceeding the additional credit granted by way of loans and advances.
Chart III.2: Rates of Growth of Money Supply (M2), Net Foreign Assets (NFA) and Domestic Credit (DC)

Reflecting increases in both net foreign assets of the banking system and total domestic credit, aggregate monetary resources, money supply M2, went up by 13.2 per cent, from Rs70,878 million at the end of June 1998 to Rs80,204 million at the end of June 1999. In 1997-98, money supply M2 grew by 17.4 per cent, triggered mainly by the increase in domestic credit. Both components of money supply M2, namely money supply M1 and quasi-money, registered positive growth in 1998-99 with the expansion of the latter being more pronounced.
Money supply M1 rose by Rs754 million, from Rs10,152 million at the end of June 1998 to Rs10,906 million at the end of June 1999. This represented an increase of 7.4 per cent, down from 14.4 per cent in 1997-98. Demand deposits grew by Rs529 million to Rs6,030 million at the end of June 1999, or by 9.6 per cent, down from 20.4 per cent in 1997-98. Currency with public went up by Rs224 million to Rs4,876 million at the end of June 1999, or by 4.8 per cent, as compared to a growth of 8.0 per cent in 1997-98.
Quasi-money, the other component of M2, increased by Rs8,572 million, from Rs60,726 million at the end of June 1998 to Rs69,298 million at the end of June 1999, or by 14.1 per cent, as compared to 17.9 per cent in 1997-98. The three components of quasi-money registered positive growth rates in 1998-99. Savings deposits went up by Rs3,587 million to Rs31,831 million at the end of June 1999, or by 12.7 per cent, lower than the growth of 17.6 per cent in 1997-98. Time deposits recorded an increase of Rs4,005 million to Rs30,239 million at the end of June 1999, or of 15.3 per cent, up from 6.0 per cent in 1997-98. Foreign currency deposits increased by Rs981 million to Rs7,229 million at the end of June 1999, or by 15.7 per cent, lower than the increase of 130.3 per cent in 1997-98.
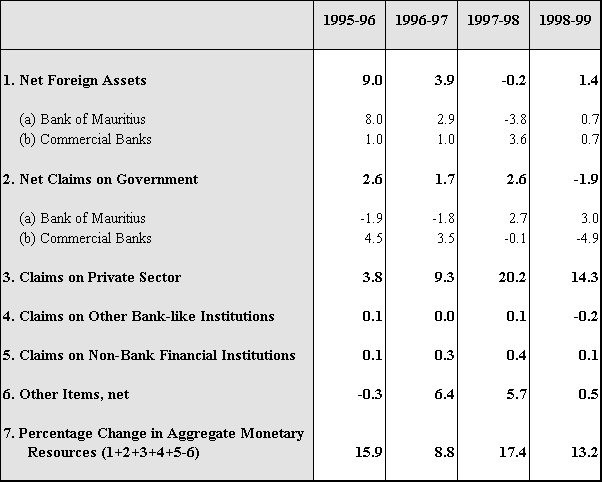
Table III.3: Sources of Change in Aggregate Monetary Resources
(Per cent)
Figures may not add up to totals due to rounding.
Chart III.1 shows the evolution of real GDP growth, inflation rate and growth of money supply M2 since 1994-95. Tables III.1, III.2 and III.3, as well as Chart III.2, provide more details on the evolution of monetary aggregates.
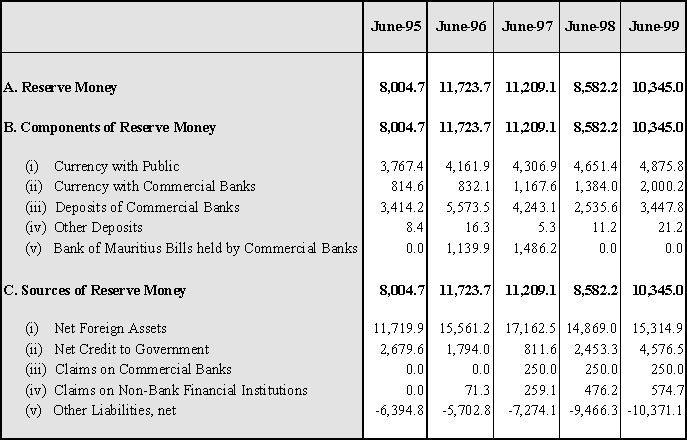
Reserve money went up by Rs1,763 million, from Rs8,582 million at the end of June 1998 to Rs10,345 million at the end of June 1999, or by 20.5 per cent, as against a fall of 23.4 per cent in the preceding fiscal year. In 1997-98, the impact of the increase in central bank credit to Government on reserve money was partly offset by the concurrent drop in the net foreign assets of the central bank. However, with both central bank credit to Government and net foreign assets of the Bank of Mauritius going up in 1998-99, the impact on reserve money was fully felt.
Table III.4: Components and Sources of Reserve Money
(Rs million)
Figures may not add up to totals due to rounding.
Net foreign assets of the Bank of Mauritius rose by Rs446 million to Rs15,315 million at the end of June 1999, or by 3.0 per cent, as against a fall of 13.4 per cent in 1997-98. Net credit to Government expanded by Rs2,124 million, from Rs2,453 million at the end of June 1998 to Rs4,577 million at the end of June 1999, or by 86.6 per cent, as compared to an increase of 202.3 per cent in 1997-98. Credit to non-bank financial institutions by the Bank of Mauritius increased by Rs99 million to Rs575 million at the end of June 1999, or by 20.7 per cent, down from a rise of 83.8 per cent in 1997-98.
Chart III.3: Components and Sources of Reserve Money
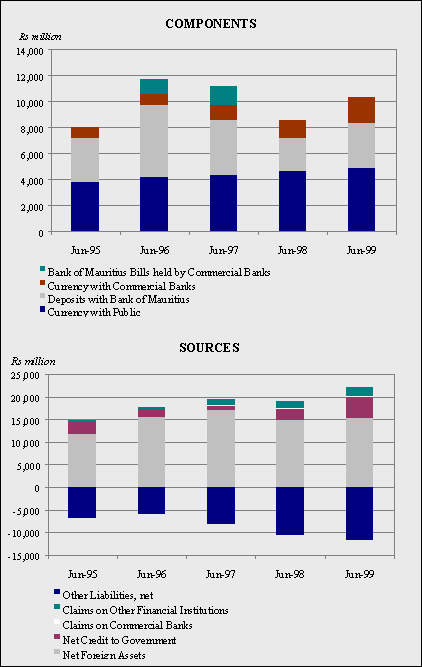
Demand deposits with the Bank of Mauritius rose by Rs922 million to Rs3,469 million at the end of June 1999, or by 36.2 per cent, as against a drop of 40.1 per cent in 1997-98. Currency with public increased by Rs224 million to Rs4,876 million, or by 4.8 per cent, lower than the rise of 8.0 per cent recorded in 1997-98. Currency with commercial banks went up by Rs616 million to Rs2,000 million at the end of June 1999, or by 44.5 per cent, up from 18.5 per cent in the preceding year.
Table III.4 and Chart III.3 show the components and sources of reserve money since June 1995.
Trends in Reserve Money and Monetary Ratios
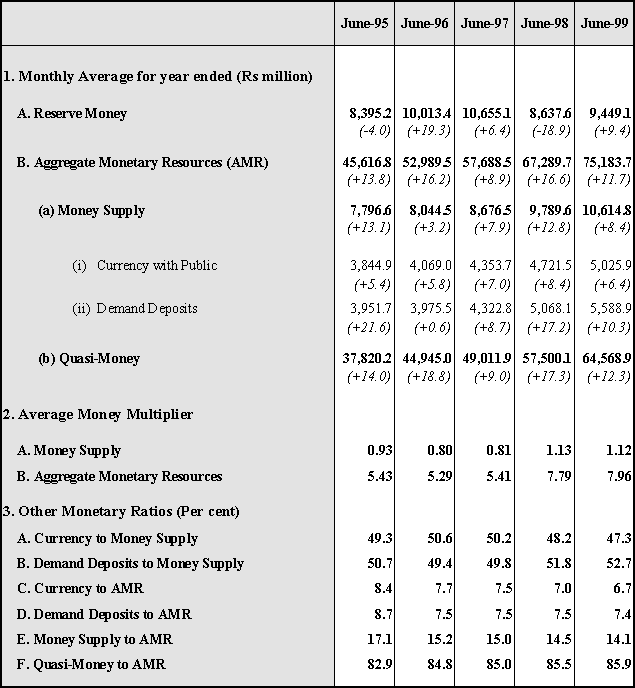
The monthly average level of reserve money increased by 9.4 per cent, from Rs8,638 million in 1997-98 to Rs9,449 million in 1998-99, in contrast to a drop of 18.9 per cent registered in 1997-98.
The monthly average level of aggregate monetary resources, money supply M2, rose from Rs67,290 million in 1997-98 to Rs75,184 million in 1998-99, representing an increase of 11.7 per cent, lower than the rise of 16.6 per cent in 1997-98. There was a deceleration in the rate of growth of the monthly average level of both components of money supply M2 in
1998-99.
The monthly average level of money supply M1 went up from Rs9,790 million in 1997-98 to Rs10,615 million in 1998-99, or by 8.4 per cent, down from 12.8 per cent in 1997-98. The monthly average level of currency with public went up by 6.4 per cent to Rs5,026 million in 1998-99 while the monthly average level of demand deposits increased by 10.3 per cent to Rs5,589 million.
The monthly average level of quasi-money went up from Rs57,500 million in 1997-98 to Rs64,569 million in 1998-99, or by 12.3 per cent, lower than the growth of 17.3 per cent recorded in 1997-98.
Table III.5: Monetary Ratios
Notes: (i) Figures in brackets represent percentage change over previous period.
(ii) Reserve Money = Currency in Circulation plus Private Demand Deposits with the Bank of Mauritius.
As from November 1991, Bank of Mauritius Bills held by commercial banks are included in Reserve Money.
(iii) The average Money Multiplier for Money Supply is defined as the ratio of average Money Supply to
average Reserve Money.
(iv) The average Money Multiplier for Aggregate Monetary Resources is defined as the ratio of
average Aggregate Monetary Resources to average Reserve Money.
The average money multiplier for money supply M1 edged down from 1.13 in 1997-98 to 1.12 in 1998-99. In contrast, the average money multiplier for money supply M2 rose from 7.79 to 7.96 over the same period.
The ratio of currency with public to money supply M1 declined from 48.2 per cent in 1997-98 to 47.3 per cent in 1998-99. As a result, the ratio of demand deposits to money supply M1 rose from 51.8 per cent to 52.7 per cent over the same period. Both the ratios of currency with public to money supply M2 and demand deposits to money supply M2 fell from 7.0 per cent and 7.5 per cent in 1997-98 to 6.7 per cent and 7.4 per cent, respectively, in 1998-99. The ratio of money supply M1 to money supply M2 dropped from 14.5 per cent in 1997-98 to 14.1 per cent in 1998-99, resulting in a rise in the ratio of quasi-money to money supply M2 from 85.5 per cent to 85.9 per cent over the same period.
Table III.5 gives more details on monetary ratios for the years ended June 1995 through June 1999.
Income Velocity of Circulation of Money
The income velocity of circulation of money is a measure of the speed at which money circulates in order to support a given volume of transactions. The income velocity of circulation of currency maintained its uptrend observed since 1992-93, rising from 14.91 in 1997-98 to 15.08 in 1998-99. The income velocity of circulation of money supply M1 increased from 9.35 in 1997-98 to 9.55 in 1998-99 while that of money supply M2 decreased marginally from 1.36 to 1.35 over the same period.
Table III.6: Income Velocity of Circulation of Money
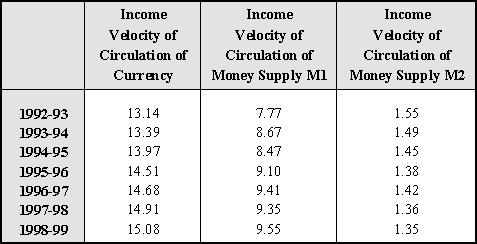
Chart III.4: Average Money Multiplier and Income Velocity of Circulation of Money
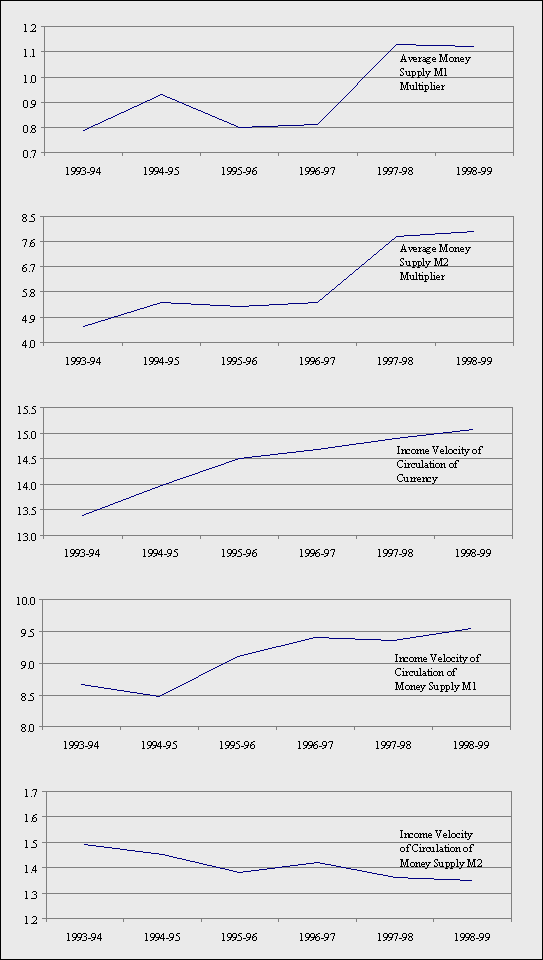
Table III.6 gives details on the income velocity of circulation of money for the years 1992-93 through 1998-99. Chart III.4 shows the average money multiplier and income velocity of circulation of money for the years ended June 1994 through June 1999.
At the end of June 1999, ten commercial banks were operating in Mauritius, namely three local banks, two foreign-owned banks incorporated locally and five branches of foreign banks. The ten commercial banks operated 149 branches, including head offices, 14 counters and 1 mobile van. The number of inhabitants per branch decreased from around 7,760 at the end of June 1998 to approximately 7,160 at the end of June 1999.
Several commercial banks offer up-to-date payment services such as credit and debit cards, direct debits and other facilities such as Automated Teller Machines (ATMs), internet banking, phone banking, home banking and PC banking.
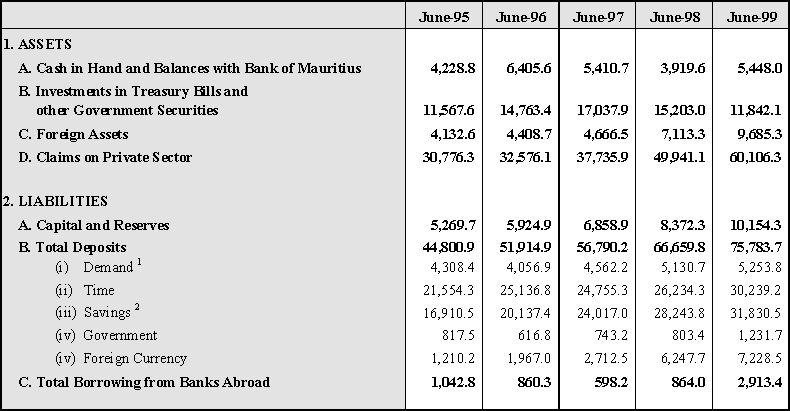
Between end-June 1998 and end-June 1999, total assets of commercial banks rose from Rs83,193 million to Rs97,183 million, or by 16.8 per cent, lower than the growth of 17.4 per cent recorded in the preceding year. Total deposits registered a rise of 13.7 per cent in 1998-99. Demand deposits went up by 2.4 per cent in 1998-99 as compared to an increase of 12.5 per cent in 1997-98. Time deposits rose by 15.3 per cent in 1998-99, higher than the increase of 6.0 per cent in 1997-98. Savings deposits recorded a rise of 12.7 per cent in 1998-99, down from 17.6 per cent in 1997-98 while Government deposits expanded by 53.3 per cent between end-June 1998 and end-June 1999 as compared to a rise of 8.1 per cent in 1997-98. Foreign currency deposits rose by 15.7 per cent in 1998-99 as compared to an increase of 130.3 per cent in 1997-98.
The share of demand and savings deposits in total deposits declined from 7.7 per cent and 42.4 per cent, respectively, at the end of June 1998 to 6.9 per cent and 42.0 per cent at the end of June 1999. Time deposits accounted for 39.9 per cent of total deposits at the end of June 1999, slightly up from 39.4 per cent at the end of June 1998. Foreign currency deposits accounted for 9.5 per cent of total deposits at the end of June 1999, marginally higher than the share of 9.4 per cent at the end of June 1998.
Table III.7: Commercial Banks' Selected Assets and Liabilities
(Rs million)
 1 Include demand deposits of Offshore Banking Units (OBUs). 2 Include margin deposits.
Figures may not add up to totals due to rounding.
Foreign liabilities of commercial banks expanded by Rs2,049 million to Rs2,913 million at the end of June 1999, or by 237.2 per cent, as compared to a rise of 44.4 per cent in 1997-98. The increase in borrowings from banks abroad accounted for 99.7 per cent of the rise in foreign liabilities as at end-June 1999. Capital and reserves of commercial banks increased by Rs1,782 million to Rs10,154 million as at end-June 1999, or by 21.3 per cent, as compared to an increase of 22.1 per cent as at end-June 1998.
Commercial banks' reserves, defined as their cash in hand and balances with Bank of Mauritius, rose by Rs1,528 million to Rs5,448 million at the end of June 1999, or by 39.0 per cent, as compared to a decline of 27.6 per cent recorded in the preceding fiscal year. Foreign assets of commercial banks rose by 36.2 per cent to Rs9,685 million in 1998-99, lower than the growth of 52.4 per cent in 1997-98. Loans to nonresidents went up by Rs93 million, or by 8.6 per cent, to Rs1,177 million at the end of June 1999 as compared to a rise of 101.3 per cent in 1997-98. Balances with banks abroad increased by 59.5 per cent to Rs6,554 million in 1998-99 as compared to a rise of 74.8 per cent in 1997-98.
Chart III.5: Selected Items of Commercial Banks' Assets and Liabilities
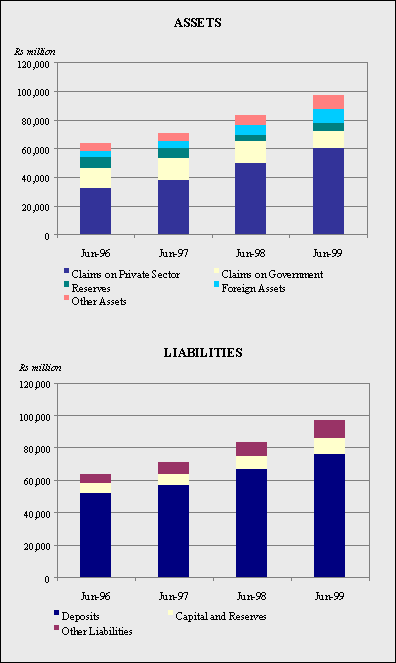
Commercial banks' claims on Government declined by 22.3 per cent to Rs11,925 million in 1998-99 as a result of the decrease of 30.0 per cent and 45.9 per cent in their investment in Treasury Bills and their advances to Government, respectively. In 1997-98, claims on Government went down by 2.1 per cent.
Chart III.6: Deposits with Commercial Banks
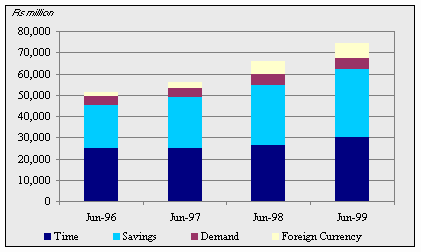
Credit to the private sector by commercial banks increased by 20.4 per cent to Rs60,106 million at the end of June 1999 as compared to a rise of 32.3 per cent in 1997-98. The credit-deposit ratio of commercial banks, inclusive of their investment in corporate shares and debentures, rose from 74.9 per cent at the end of June 1998 to 79.3 per cent at the end of June 1999.
The average balance per current, savings and time deposits account stood at Rs94,749, Rs24,719 and Rs284,395, respectively, at the end of June 1999.
Table III.7 and Charts III.5 and III.6 give details on selected assets and liabilities of commercial banks.
Sectorwise Distribution of Credit to the Private Sector
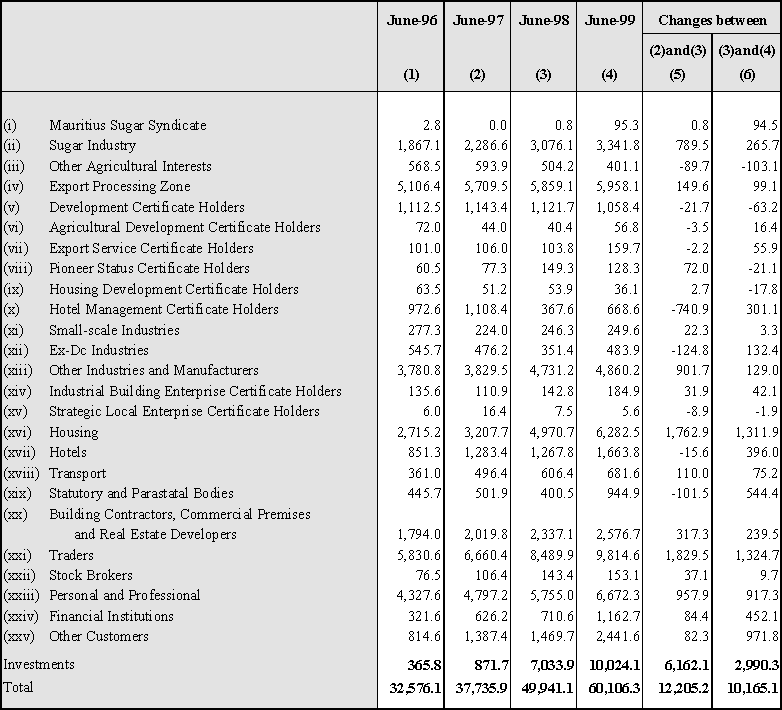
Between end-June 1998 and end-June 1999, commercial bank credit to the private sector increased by Rs10,165 million, from Rs49,941 million to Rs60,106 million, or by 20.4 per cent, lower than the growth rate of 32.3 per cent in the preceding year. About 65 per cent (Rs6,566 million) of the additional credit represented investment by way of debentures (Rs3,012 million) and loans and advances to Traders (Rs1,325 million), Housing (Rs1,312 million) and Personal and Professional (Rs917 million). Other sectors that registered significant increases in credit were Statutory and Parastatal Bodies (Rs544 million) and Financial Institutions (Rs452 million). The largest decline in credit was recorded in the Other Agricultural Interests sector with a drop of Rs103 million.
Total credit allocated to the sugar industry rose by Rs360 million, from Rs3,077 million at the end of June 1998 to Rs3,437 million at the end of June 1999, or by 11.7 per cent, down from 34.6 per cent in 1997-98. The share of credit to the sugar industry in total private sector credit declined from 6.2 per cent at the end of June 1998 to 5.7 per cent at the end of June 1999.
Total credit to the manufacturing sector (EPZ, DC, Pioneer, Ex-Dc and Other Industries and Manufacturers) increased by Rs276 million, from Rs12,213 million at the end of June 1998 to Rs12,489 million at the end of June 1999, representing a rise of 2.3 per cent as compared to 8.7 per cent in the previous year. The rise in credit to the EPZ accounted for 35.9 per cent of the increase in credit to the manufacturing sector in 1998-99 as compared to 15.3 per cent in the previous year. The share of credit to the manufacturing sector in total private sector credit declined from 24.5 per cent at the end of June 1998 to 20.8 per cent at the end of June 1999.
Credit to the Personal and Professional sector rose by Rs917 million, from Rs5,755 million at the end of June 1998 to Rs6,672 million at the end of June 1999, or by 15.9 per cent, down from 20.0 per cent in the previous fiscal year. The share of this sector in total private sector credit fell from 11.5 per cent at the end of June 1998 to 11.1 per cent at the end of June 1999.
Chart III.7: Sectorwise Distribution of Credit to the Private sector
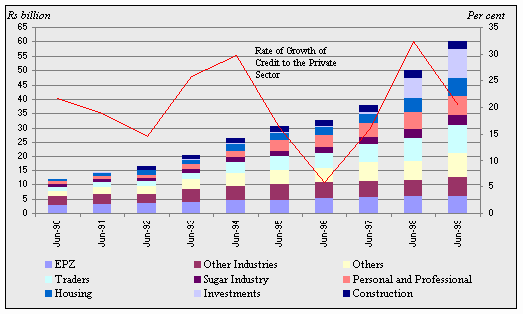
Growth of credit to Traders fell from 27.5 per cent in 1997-98 to 15.6 per cent in 1998-99. In absolute terms, credit rose by Rs1,325 million, from Rs8,490 million at the end of June 1998 to Rs9,815 million at the end of June 1999. Outstanding credit to Traders represented 16.3 per cent of total credit to the private sector at the end of June 1999, down from 17.0 per cent at the end of June 1998.
The growth of credit to the Construction sector (Housing Development Certificate Holders, Industrial Building Enterprise Certificate Holders, Building Contractors, Commercial Premises and Real Estate Developers) went down from 16.1 per cent in 1997-98 to 10.4 per cent in 1998-99. In absolute terms, credit to that sector rose by Rs264 million, from Rs2,534 million at the end of June 1998 to Rs2,798 million at the end of June 1999. Credit to Housing grew by 26.4 per cent in 1998-99, lower than the growth of 55.0 per cent in 1997-98.
Credit to Hotels rose by Rs697 million to Rs2,332 million at the end of June 1999, or by 42.6 per cent, as compared to a decline of 31.6 per cent in 1997-98.
Table III.8: Sectorwise Distribution of Credit to the Private Sector
(Rs million)
Figures may not add up to totals due to rounding.
Table III.8 shows a breakdown of the sectoral distribution of private sector credit as at end-June 1996, 1997, 1998 and 1999. Chart III.7 shows the evolution of private sector credit from end-June 1990 to end-June 1999.
Maintenance of Cash Ratio by Commercial Banks
The minimum cash reserve ratio requirement of commercial banks was reduced from 6.0 per cent to 5.5 per cent with effect from the first monitoring week of July 1998. In calculating the cash ratio, deposits denominated in all currencies are taken into account.
Table III.9: Average Cash Ratio Maintained by Commercial Banks

The average cash ratio maintained by commercial banks in 1998-99 ranged from 5.5 per cent to 8.4 per cent. From Rs4,110 million in the last week of July 1998, the average cash balances of commercial banks fell to a trough of Rs3,639 million in the second week of August 1998 before peaking at Rs5,845 million in the last week of January 1999. Thereafter, they subsided to close at Rs4,523 million as at end-June 1999.
Average excess cash balances held by commercial banks fluctuated widely between a minimum of Rs20 million in the second week of July 1998 and a maximum of Rs2,001 million in the last week of January 1999.
Chart III.8: Average Excess Cash Balances and Average Cash Ratio
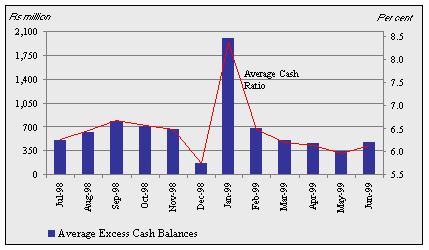
Table III.9 and Chart III.8 give more details on the average cash ratio maintained by commercial banks in 1998-99.
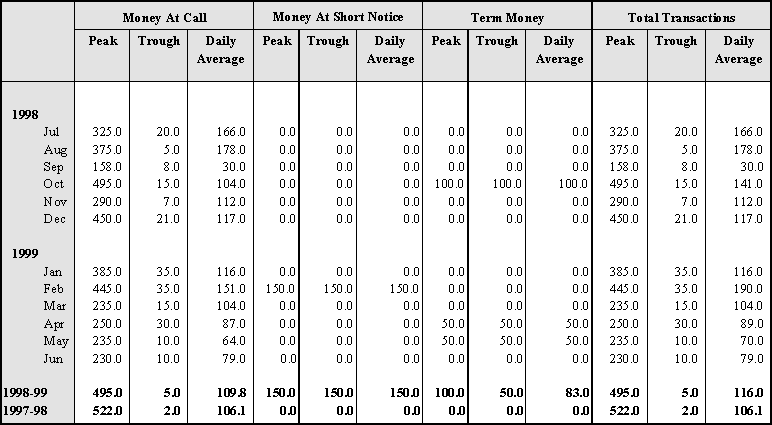
Interbank transactions are carried out among commercial banks for call (overnight), short notice (up to 7 days) and term money (more than 7 days). In 1998-99, interbank transactions remained concentrated in the call money market. The daily average amount of interbank transactions rose from Rs106 million in 1997-98 to Rs116 million in 1998-99. Around 54 per cent of total interbank transactions (representing a daily average of Rs126 million) were carried out in the first half of 1998-99 and the remaining 46 per cent (representing a daily average of Rs107 million) in the second half of the fiscal year. Total interbank transactions reached a trough of Rs5 million in August 1998 and a peak of Rs495 million in October 1998.
Table III.10: Interbank Transactions
(Rs million)
Interbank interest rates fluctuated within a wider and higher range of 7.50-18.00 per cent in 1998-99 as compared to a range of 5.75-12.00 per cent in 1997-98. Reflecting the upward trend in the overall weighted average yield on Treasury Bills at primary auctions, the weighted average interbank interest rate rose to 9.87 per cent in 1998-99 from 8.11 per cent in 1997-98. From a low of 8.91 per cent in September 1998, the weighted average interbank interest rate reached a peak of 11.09 per cent in January 1999 before declining to 9.96 per cent in June 1999.
Table III.11: Interbank Interest Rates
(Per cent)

Chart III.9: Interbank Transactions and Weighted Average Interbank Interest Rate
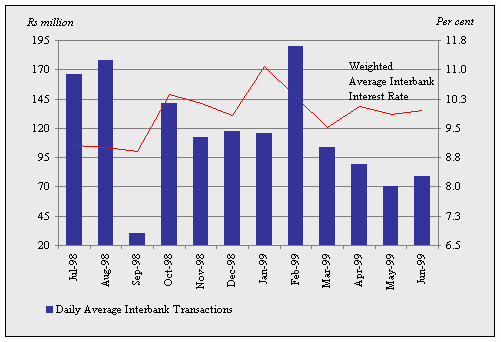
Tables III.10 and III.11 as well as Chart III.9 give more details on interbank transactions and interbank interest rates in 1998-99.
Central Bank Credit to Commercial Banks
As the lender of last resort, the Bank of Mauritius continued to lend to commercial banks at its discretion in terms of both rate and volume. However, recourse by banks to central bank overnight advances was limited to the months of August, October and December 1998 and January 1999.
The Bank of Mauritius started the auctioning of Treasury Bills with maturities of 30 days and 728 days during 1998-99, thus increasing the number of maturities at primary auctions from three to five. The auctioning of Treasury Bills with 30 days maturity started in December 1998 to provide investors with an additional instrument for shorter term liquidity management and to give a boost to the short-term money market. The 728-day Treasury Bill was introduced in July 1998 with a view to providing a financial instrument for medium term investment.
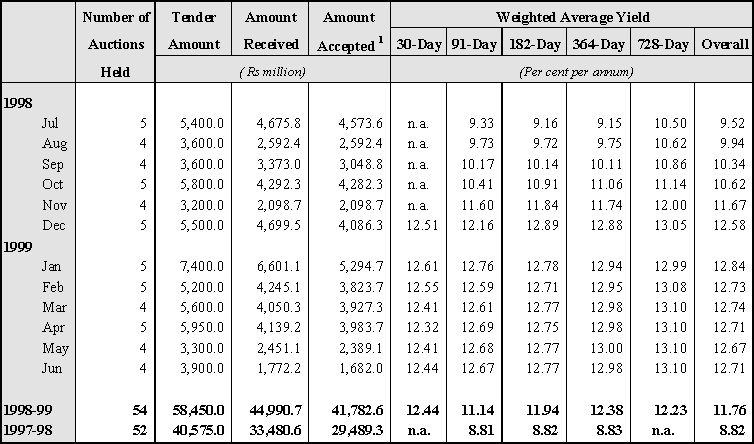
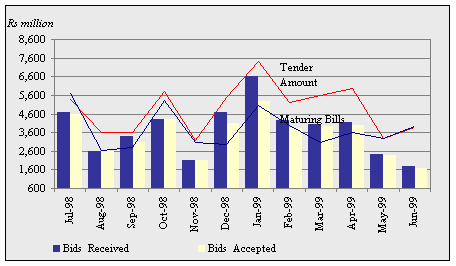
During 1998-99, 54 auctions of Treasury Bills with 30-day, 91-day, 182-day, 364-day and 728-day maturity were held on a weekly/bi-weekly basis. A total amount of Rs58,450 million of Treasury Bills were put on tender. Bids amounting to Rs44,991 million were received, of which a total of Rs41,783 million was accepted. The total amount of bids accepted accounted for 71.5 per cent of the total tender amount and for 92.9 per cent of the value of total bids received. The Bank of Mauritius underwrote an amount of Rs8,928 million of Treasury Bills at primary auctions during 1998-99.
Participants in the primary market maintained a preference for short-end maturities throughout 1998-99. Treasury Bills of 30-day and 91-day maturities accounted for 57.4 per cent of total bids received. Non-bank institutions were the most active on the primary market with their share of total bids received rising significantly from 28.4 per cent in 1997-98 to 50.5 per cent in 1998-99. Correspondingly, the share of commercial banks in total bids received declined to 49.5 per cent in 1998-99 from 71.6 per cent in the preceding year.
Table III.12: Auctioning of Treasury Bills
1
Excludes underwriting by the Secondary Market Cell (SMC) of the Bank of Mauritius.n.a: Not applicable
The weighted average yield on Treasury Bills of various maturities assumed an upward trend during 1998-99, reflecting the tight monetary policy stance pursued by the Bank of Mauritius with a view to curbing inflationary pressures in the economy and stabilising the exchange rate of the rupee. The overall weighted average yield on Treasury Bills increased by 2.94 percentage points in 1998-99, from 8.82 per cent in 1997-98 to 11.76 per cent in 1998-99.
The weighted average yield on 30-day Treasury Bills went up from 12.51 per cent in December 1998, when it was introduced, to a high of 12.61 per cent in January 1999. It thereafter declined gradually to touch a low of 12.32 per cent in April 1999 before rising again and reaching 12.44 per cent in June 1999. The weighted average yield on 30-day Treasury Bills for 1998-99 stood at 12.44 per cent.
The weighted average yield on 91-day Treasury Bills rose steadily from a low of 9.33 per cent in July 1998 to a peak of 12.76 per cent in January 1999 before subsiding and falling to 12.67 per cent in June 1999. The weighted average yield on 91-day Treasury Bills went up by 2.33 percentage points, from 8.81 per cent in 1997-98 to 11.14 per cent in 1998-99.
Chart III.10: Auctioning of Treasury Bills
The weighted average yield on 182-day Treasury Bills went up from a low of 9.16 per cent in July 1998 to a high of 12.89 per cent in December 1998. It declined to 12.71 per cent in February 1999, before rising to 12.77 per cent in June 1999. The weighted average yield on 182-day Treasury Bills recorded an increase of 3.12 percentage points, from 8.82 per cent in 1997-98 to 11.94 per cent in 1998-99.
Chart III.11: Weighted Average Yields on Treasury Bills at Primary Auctions

The weighted average yield on 364-day Treasury Bills rose from a low of 9.15 per cent in July 1998 to a peak of 13.00 per cent in May 1999 before declining to 12.98 per cent in June 1999. The weighted average yield on 364-day Treasury Bills rose by 3.55 percentage points, from 8.83 per cent in 1997-98 to 12.38 per cent in 1998-99.
The weighted average yield on 728-day Treasury Bills went up steadily from 10.50 per cent in July 1998, when it was introduced, to 13.05 per cent in December 1998. After declining to 12.99 per cent in January 1999, it picked up and, in March 1999, reached a peak of 13.10 per cent where it remained until the end of June 1999. The weighted average yield on 728-day Treasury Bills for 1998-99 stood at 12.23 per cent.
The overall weighted average yield on Treasury Bills of the five maturities rose continuously from 9.52 per cent in July 1998 to a high of 12.84 per cent in January 1999 before coming down to 12.71 per cent in June 1999. The overall weighted average yield went up by 2.94 percentage points to 11.76 per cent in 1998-99. In 1997-98, the overall weighted average yield for 91-day, 182-day and 364-day Treasury Bills was 8.82 per cent.
Table III.12 and charts III.10 and III.11 give detailed information on the auctioning of Treasury Bills in 1998-99.
As from 14 December 1998, the Bank of Mauritius started selling, on a first come first served basis, Government of Mauritius Treasury Bills over the counter to individuals and non-financial corporations. These sales gave a boost to secondary market activities.
Secondary market transactions in Treasury Bills outside the Secondary Market Cell (SMC) of the Bank of Mauritius went up by 2.2 per cent to Rs1,884 million in 1998-99 and represented 16.5 per cent of total secondary market activities as compared to 26.5 per cent in 1997-98. Around 63 per cent of these transactions were carried out in the first half of the fiscal year 1998-99, with a peak of Rs406 million in September 1998. In 1997-98, around 71 per cent of the total purchases were made in the first half of the fiscal year.
Table III.13: Dealings in Government Securities
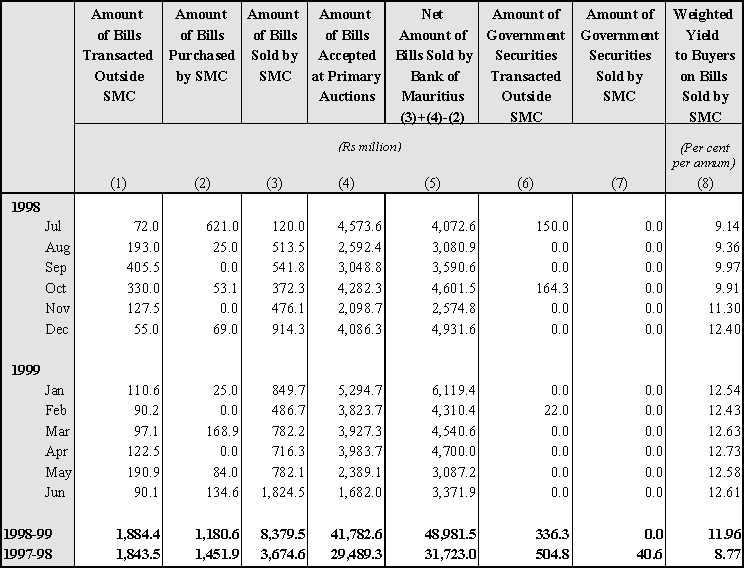
Total amount of Treasury Bills purchased by the SMC of the Bank of Mauritius, exclusive of Treasury Bills underwritten at primary auctions, declined by Rs271 million, from Rs1,452 million in 1997-98 to Rs1,181 million in 1998-99, representing a fall of 18.7 per cent. Purchases were at a peak of Rs621 million in July 1998 and were at a trough of Rs25 million in August 1998 and January 1999. Total amount of Treasury Bills sold by the SMC surged by Rs4,705 million, or 128.0 per cent, in 1998-99. Around 65 per cent of sales, representing an amount of Rs5,442 million, were made in the second half of the year under review with a peak of Rs1,825 million in June 1999. Net sales of Treasury Bills by the Bank of Mauritius rose by Rs17,259 million, or 54.4 per cent, to Rs48,982 million in 1998-99.
The overall weighted average yield to buyers on Treasury Bills sold by the SMC went up by 3.19 percentage points, from 8.77 per cent in 1997-98 to 11.96 per cent in 1998-99.
During 1998-99, there were no dealings in Mauritius Development Loan Stock by the SMC, but transactions involving these securities outside the SMC amounted to Rs336 million, lower than the value of Rs505 million in 1997-98.
Table III.13 gives details on dealings in Government Securities during 1998-99.
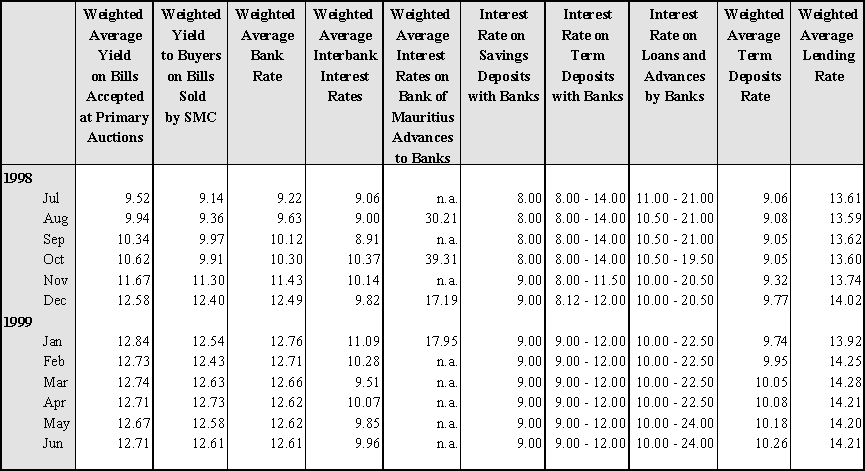
Reflecting the tight stance of monetary policy, there was a marked rise in interest rates in 1998-99. Between June 1998 and June 1999, the weighted average yield on Treasury Bills sold on both the primary and secondary markets rose by about 3.5 percentage points. The Bank Rate, which is equivalent to the weighted average yield on Treasury Bills (excluding the 728-day Treasury Bill) accepted at primary auctions, rose by more or less the same margin. The weighted average interest rate on the interbank money market registered, however, a more modest increase of 1.6 percentage points over the same period. Commercial banks raised their rate of interest on savings deposits by one percentage point to 9.00 per cent at the end of November 1998. The weighted average interest rate on central bank advances to commercial banks ranged between 17.19 per cent and 39.31 per cent in 1998-99.
The weighted average yield on Treasury Bills on the primary market increased successively from 9.08 per cent in June 1998 to 9.52 per cent in July 1998 and thereafter to 12.71 per cent in June 1999, with a peak of 12.84 per cent in January 1999. Whilst slightly lower than the weighted average yields obtained on the primary market, the weighted average yield on the secondary market rose from 9.14 per cent in July 1998 to 12.61 per cent in June 1999 with a peak of 12.73 per cent in April 1999.
The weighted average Bank Rate moved from a low of 9.22 per cent in July 1998 to a peak of 12.76 per cent in January 1999 before declining to 12.61 per cent in June 1999.
Table III.14: Principal Interest Rates
(Per cent per annum)
n.a.: Not applicable
Except for the month of October 1998, the weighted average interbank interest rate remained consistently lower than the weighted average Bank Rate during 1998-99. From 9.06 per cent in July 1998, it reached a trough of 8.91 per cent in September 1998 and a peak of 11.09 per cent in January 1999 before closing the year at 9.96 per cent. This resulted in a widening of the spread between the weighted average Bank Rate and the weighted average interbank interest rate from 0.16 percentage point in July 1998 to 2.65 percentage points in June 1999. During the second half of the fiscal year, the weighted average Bank Rate remained consistently above 12.60 per cent while the weighted average interbank interest rate hovered within a range between 9.51 per cent and 11.09 per cent.
At the end of November 1998, commercial banks raised the interest rate on savings deposits from 8.00 per cent to 9.00 per cent. Interest rates on term deposits with banks were subsequently adjusted upwards from 8.00 per cent to 9.00 per cent for shorter term deposits. Interest rates on longer term deposits, however, were revised downward, from a high of 14.00 per cent in July 1998 to 12.00 per cent as from December 1998.
Chart III.12: Weighted Average Bank Rate and Interbank Interest Rate, and Inflation Rate
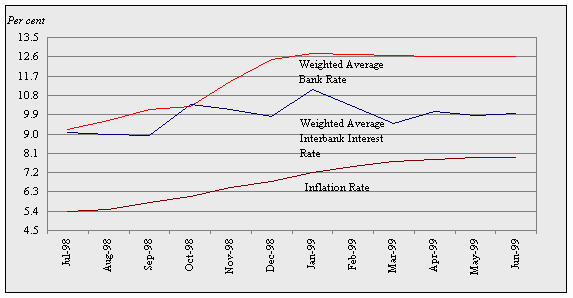
With the rise in the inflation rate from 5.4 per cent in 1997-98 to 7.9 per cent in 1998-99, the real interest rate on savings deposits declined from a high of 2.47 per cent in July 1998 to a low of 1.02 per cent in June 1999.
In July 1998, there was a rise of one percentage point, from 10.00 per cent to 11.00 per cent, in the lower limit of the interest rates charged by commercial banks on loans and advances. In November 1998, however, the interest rate was brought down to its initial level of 10.00 per cent, the same level as that charged throughout 1997-98. At the higher end of the spectrum, interest rates on loans and advances decreased from 21.00 per cent in July 1998 to 19.50 per cent in October 1998. Top lending rates thereafter started to increase steadily to reach 20.50 per cent in November 1998, 22.50 per cent in January 1999 and 24.00 per cent in May and June 1999.
The weighted average term deposits rate of commercial banks reached a trough of 9.05 per cent in September and October 1998 and a peak of 10.26 per cent in June 1999. The weighted average lending rate charged by commercial banks ranged from a low of 13.59 per cent in August 1998 to a high of 14.28 per cent in March 1999.
Chart III.13: Weighted Average Lending and Term Deposits Rates
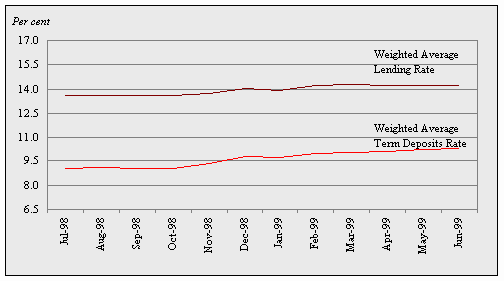
The spread between the weighted average term deposits interest rate and the weighted average lending rate in 1998-99 remained more or less at the same level as in the preceding year. The spreads varied between 4.0 percentage points in June 1999 and 4.6 percentage points in September 1998. This tends to indicate that the level of competition in the banking sector in 1998-99 has remained the same as in 1997-98.
Table III.14 and Charts III.12 and III.13 give more details on the interest rate structure in Mauritius.
The Stock Exchange of Mauritius (SEM) started operations in July 1989. Initially, five companies with a market capitalisation of Rs1.1 billion were listed on the official market of the SEM. At the end of June 1999, 47 companies were listed on the Official Market with a market capitalisation of Rs38.4 billion.
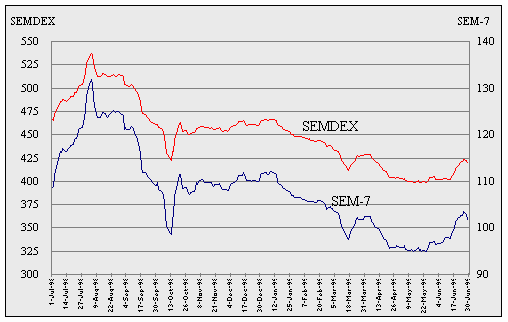
During 1998-99, there were 250 trading sessions on the Official Market with the aggregate value of transactions amounting to Rs2.4 billion for a volume of 84.2 million shares and debentures transacted. The SEMDEX, the stock market index, rose from 381.47 at the end of June 1997 to 467.15 at the end of June 1998 but declined to 418.87 at the end of June 1999.
The SEM-7, which was introduced on 30 March 1998, is an index which measures movements in the seven largest eligible shares on the official list in terms of market capitalisation, liquidity and investibility. The composition of the SEM-7 changed 4 times during 1998-99, with the last change effected on 8 April 1999. As at 30 June 1999, the SEM-7 comprised shares of the State Bank of Mauritius Ltd, The Mauritius Commercial Bank Ltd, New Mauritius Hotels Ltd, Sun Resorts Ltd, Rogers & Co. Ltd, Grand Baie Hotel Ltd, and Mauritius Breweries Ltd.
The SEM-7 declined from 108.88 on 30 June 1998 to 101.49 on 30 June 1999. On 4 August 1998, the SEMDEX and the SEM-7 reached an all-time high of 537.31 and 131.78, respectively, and market capitalisation for all companies listed on the Stock Exchange reached Rs52.3 billion. The SEMDEX reached its lowest level of 398.51 on 18 May 1999 while the SEM-7 attained its minimum level of 94.97 on 13 May 1999. The turnover recorded on the Over-the-Counter (OTC) Market for shares was Rs174.1 million with a volume of 56.1 million shares transacted during the 97 sessions held in 1998-99.
Measures announced in the 1999-00 budget to boost stock market activity included new regulations on employee share schemes, a new framework for share buy-back operations and tax deduction for small investors buying shares on the stock market.
Chart III.14: Movements in the SEMDEX and the SEM-7
Investment effected by foreign investors on the SEM turned from a net inflow of Rs1250.5 million in 1997-98 to a net outflow of Rs345.9 million in 1998-99, possibly reflecting an increase in risk aversion among foreign investors towards emerging markets in the wake of the Asian crisis and the financial crisis in Russia.
Chart III.14 shows the movements in the SEMDEX and SEM-7 during 1998-99.
Non-Bank Financial Intermediaries
Development Bank of Mauritius (DBM)
The DBM provides financial assistance to different sectors of the economy, such as manufacturing, agriculture, tourism, construction, transport, educational and health sectors. Total assets of the DBM were valued at Rs4.3 billion as at 30 June 1999 as compared to Rs4.6 billion as at 30 June 1998. Investments of the DBM in Treasury Bills increased from Rs24 million at the end of June 1998 to Rs153 million at the end of June 1999. Equity holdings of the DBM went up from Rs54 million at end-June 1998 to Rs59 million at end-June 1999. Total loans disbursed by the DBM during the year ended June 1999 amounted to Rs721 million as compared to Rs610 million in the preceding year.
The Mauritius Housing Company Ltd (MHC)
The MHC provides housing loans to individuals in the country. At the end of June 1999, total assets of the MHC were estimated at Rs4.4 billion as compared to Rs4.2 billion at the end of June 1998. Total borrowings of the MHC amounted to Rs530 million for 1997-98 as compared to Rs475 million in 1998-99. Total loans disbursed to individuals stood at Rs361 million in 1998-99 as compared to Rs476 million in 1997-98.
The Mauritius Leasing Company (MLC)
The MLC provides financial leases to companies and individuals. At the end of June 1999, total assets of the company stood at Rs966 million as compared to Rs711 million at the end of June 1998. The number of new lease contracts increased significantly from 462 at the end of June 1998 to 595 at the end of June 1999. Disbursements rose from Rs448 million in 1997-98 to Rs558 million in 1998-99. Net investment in financial leases went up from Rs691 million at the end of June 1998 to Rs875 million at the end of June 1999.
The National Pensions Fund (NPF) is one of the largest non-bank financial institutions. The Fund consists of contributions made to the National Pensions Scheme by employees and employers both in the public and private sectors. Total investment portfolio of the Fund increased from Rs12.9 billion at the end of June 1998 to Rs14.9 billion at the end of June 1999. Investment in Government securities rose from Rs7.1 billion as at end June 1998 to Rs9.6 billion as at end June 1999. During the year ended June 1999, total loans disbursed amounted to Rs1.4 billion as compared to Rs1.5 billion in the preceding year.
Post Office Savings Bank (POSB)
The POSB mobilises savings primarily from small depositors in the country. The resources mobilised are invested in short and long term Government papers and also in a mutual fund which provides loans and financial assistance to civil servants. At the end of June 1999, total savings deposits of the POSB stood at Rs556 million as compared to Rs527 million at the end of June 1998. Total investment in Government securities stood at Rs173 million at the end of June 1999 as compared to Rs180 million at the end of June 1998. Total assets of the POSB rose from Rs651 million at the end of June 1998 to Rs723 million at the end of June 1999.
The State Investment Corporation Ltd (SIC)
The SIC manages the investment portfolio of the Government in the private sector and offers a wide range of services including financing of enterprises and joint venture arrangements with local and foreign entrepreneurs. At the end of June 1998, total assets of the SIC stood at Rs2.4 billion as compared to Rs2.3 billion at the end of June 1997. Its investment in private enterprises decreased significantly from Rs245 million at the end of June 1997 to Rs55 million at the end of June 1998.
The State Insurance Company of Mauritius Ltd
The State Insurance Company of Mauritius Ltd mobilises its resources through the collection of premia in respect of life and general insurance covers and medical and pension schemes. Total sum insured rose from Rs8.4 billion for the year ended 30 June 1997 to Rs8.7 billion for the year ended 30 June 1998. Total assets of the Pension Schemes managed by the company amounted to Rs3.5 billion at the end of June 1998 as compared to Rs2.8 billion at the end of June 1997. The number of clients benefiting from housing loan facilities was 7,663 as at 30 June 1997, which increased to 8,175 as at 30 June 1998. Total assets of State Insurance Corporation of Mauritius Ltd, excluding managed Pension and Medical Funds, stood at Rs1.6 billion as at 30 June 1997, increasing to Rs1.95 billion by 30 June 1998.
The Sugar Insurance Fund Board (SIFB)
The SIFB has been set up to provide insurance cover to all sugar producers. Total assets of the SIFB increased from Rs1,288 million at the end of May 1998 to Rs1,576 million at the end of May 1999. Loans disbursed by the Fund totalled Rs938 million at the end of May 1999, higher than the amount of Rs649 million disbursed at the end of May 1998. Investment in Government securities by the Fund stood at Rs326 million at the end of May 1999 as compared to Rs332 million at the end of May 1998.