
The Governor
Bank of Mauritius
Port Louis
11 October 1999
Dr the Honourable Vasant Kumar Bunwaree,
Minister of Finance,
Government House,
Port Louis.
Dear Minister of Finance
Annual Report and Audited Accounts 1998-99
In accordance with the provision of section 45 (1) of the Bank of Mauritius Act, I transmit herewith the thirty-second Annual Report and audited Accounts of the Bank for the year ended 30 June 1999.
Yours sincerely
(sd) Rameswurlall Basant Roi
The Mauritian economy performed well during 1998-99. This performance has been characterised by sustained economic growth, employment creation mainly in the services and manufacturing sectors, a reduction in the external current account deficit and a relatively comfortable level of net international reserves against the backdrop of global economic turbulence. Prospects for 1999-00 are clouded by the prolonged drought conditions. The economy is forecast to grow by 4 per cent in 1999-00 against the trend growth rate of around 5 per cent. However, a reversal to the trend growth rate is expected in the years ahead.
Several developments contributed to higher rate of inflation during the year under review. These include the high rate of monetary expansion during the preceding fiscal year, increases in salary stemming from the implementation of the public sector pay award in September 1998, drought conditions which prevailed since the end of 1998, the introduction of the value-added tax and the lagged impact of the depreciation of the rupee. In the light of these conditions, the Bank had no option but to immediately move for a tightening of monetary policy towards the end of 1998. This approach helped contain the inflation rate for the fiscal year 1998-99 to 7.9 per cent against the targeted rate of 8 per cent. For the fiscal year 1999-00, the Bank of Mauritius will be targeting an inflation rate of 6 per cent. While efforts will continue to be directed towards the development of an unfettered money market, a further strengthening of indirect monetary control is envisaged with a view to achieving lasting stability of monetary conditions. In this context, a principal objective of the Bank is to achieve a narrowing down of the inflation differential between Mauritius and its major trading partners in the medium term.
The re-orientation of the monetary policy stance towards the end of 1998 brought about a better integration of the domestic money and the interbank foreign exchange markets, thus imparting greater stability to the exchange value and restoring confidence in the rupee. The exchange rate of the rupee during the period under review has moved in consonance with both international trends and local market conditions. Banks have demonstrated a greater sense of discipline in factoring developments in the domestic economy as well as in the international foreign exchange market in the determination of their opening rates. As the Bank seeks to achieve a closer integration of our financial market with the world financial markets, market discipline will be a key factor in this direction. Since opening exchange rates quoted by banks set direction in the foreign exchange market, it is important that banks continue to exercise caution in the determination of their indicative exchange rates. The exchange rate of the rupee should continue to reflect the macroeconomic fundamentals of the country and, in line with current policy, intervention by the Bank of Mauritius will be guided by such considerations as to smooth out seasonal fluctuations and to avert disruptive short-term mis-alignments of the exchange rate of the rupee. Continued vigilance will be exercised to ensure that the competitiveness of our economy is not eroded.
The Mauritian economy was insulated against the Asian crisis. However, one of the major lessons that we should draw from the crisis is that a few good macroeconomic virtues are not sufficient to guarantee economic and financial stability. Monetary policy has to go hand in hand, for example, with a fiscal policy which plays its stabilization role. In the present context, increases in wages and salaries not related to productivity growth could threaten the external payments position of the country. A prudent and consistent wage policy is therefore warranted. Simultaneously, greater efforts inevitably need to be devoted towards speeding up the process of fiscal adjustment. This adjustment process, which has been set in a medium-term framework, is well under way with the replacement of the sales tax by the value-added tax and the improved buoyancy of tax revenue. Further fiscal consolidation is needed to reduce Government’s reliance on bank financing so as to keep monetary growth on an even keel and to broaden the scope for the sound development of productive sectors.
Net international reserves, which provide a more appropriate measure of import cover than the foreign exchange reserves of the Bank of Mauritius alone, remained comfortable during the year and would need to be maintained at prudent levels keeping in view the economy’s future requirements. In spite of the expected shortfall in sugar export receipts due to drought conditions, the Bank of Mauritius has initiated steps to ensure that our reserves position is not unduly affected.
The Asian crisis has demonstrated dramatically the need for financial institutions to operate on a sound basis. More than ever, greater attention is focused on the soundness of financial institutions in Mauritius. The operation of financial institutions should be well geared to advance rather than hinder economic growth. Prudential regulations, however stringent and unpleasant to individual financial enterprises, do in the end ensure robustness of the financial system. In a liberalised world financial environment, risks of failures are high. The urge to grow big too fast carries with it the seed for failures. The recent past is littered with examples of such failures. The limitations of the free market are commonplace. The case for prudential regulations that complement market forces by the adoption of a more responsive stance to the limitations of the market is strong. With a view to enhancing the soundness of the banking system, issues relating to the proper identification of non-performing loans by banks, the extent of provisioning made by them and management of risk associated with high concentration ratios in their portfolios have been addressed by the Bank of Mauritius.
The Mauritius Code of Banking Practice, prepared by the Bank of Mauritius in collaboration with commercial banks, became effective on 1 July 1998. Its main objective is to ensure that banks act fairly, reasonably and responsibly in all their dealings with customers, thereby increasing transparency by helping customers understand how their accounts operate and what they can reasonably expect from banks.
The Bank of Mauritius has actively addressed the millennium bug problem within the banking sector with a view to ensuring that this sector is Year-2000 compliant. As part of the measures forming part of its contingency plan, the Bank has made appropriate arrangements to ensure an ample supply of currency to suitably meet any Year-2000 related additional demands for cash.
The Bank revived its project for the implementation of a real time gross settlement (RTGS) system as part of its efforts to modernise financial system infrastructure and improve the working of the payments system. The implementation of the Mauritius Automated Clearing and Settlement System in the near term, with the assistance of the World Bank, will become one of the milestones for better integrating financial sector operations and opening up new and more efficient avenues in the provision of financial services to the public.
The Bank has made its contribution at the regional level in the South African Development Community (SADC) and the Common Market for Eastern and Southern Africa (COMESA) through its presence at the meetings of the Committee of Central Bank Governors. Mauritius hosted the meeting of the SADC Heads of State in September 1998. The Bank has also assumed an important responsibility in the harmonisation of regional banking supervisory standards in the Eastern and Southern Africa (ESAF) Group of Banking Supervisors.
Finally, I wish to place on record my appreciation of the sense of commitment and dedication with which the staff have served the Bank during the past year. No efforts have been spared by the management of the Bank to improve the physical work environment and working conditions of the employees and to invest in training and human resource development. Finally, the objectives of the Bank would not have been attained without the dedication and support of the Board of Directors.
Rameswurlall Basant Roi
Viewed against the backdrop of the recent global economic turmoil, the performance of the Mauritian economy during the fiscal year 1998-991 was quite commendable. It was characterised by the continued buoyancy of economic growth, a reduction of the budget deficit to GDP ratio, a lowering of the current account deficit of the balance of payments and the maintenance of a relatively comfortable level of net international reserves. Economic expansion was broad-based, driven by the sugar, Export Processing Zone (EPZ), tourism and the financial and business sectors. Reflective of this growth momentum, per capita Gross National Product (GNP) at market prices increased. This growth performance was also accompanied by employment creation mainly in the services and manufacturing sectors of the economy. While the Bank of Mauritius targeted an inflation rate of 8 per cent for the fiscal year 1998-99, the actual rate of inflation was 7.9 per cent. On the external front, the current account of the balance of payments posted a lower deficit in 1998-99 than in the preceding fiscal year. This improvement stemmed mainly from the increase in the surplus registered on the services account. The rate of monetary expansion, as measured by the growth of money supply M2, decelerated during the period under review.
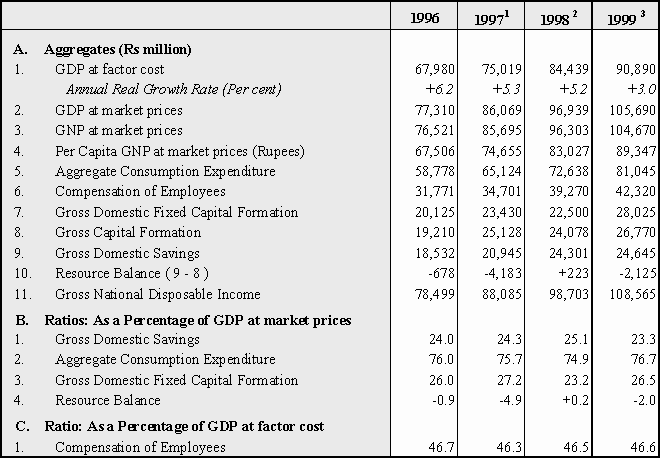
Gross Domestic Product (GDP) at factor cost went up in nominal terms by 12.6 per cent in 1998 and is estimated to rise by 9.0 per cent in 1999. Real GDP registered an appreciable growth rate of 5.2 per cent in 1998 following the increase of 5.3 per cent in 1997. It is expected to fall to 3.0 per cent in 1999, largely on account of the adverse impact of the drought on the agricultural sector.
All sectors, except agriculture, witnessed positive growth ranging from 3.0 per cent to 8.6 per cent in 1998. The highest expansion of 8.6 per cent was recorded in "Insurance and Other Business Services" followed by "Financial Institutions", which grew by 8.0 per cent. Among the major contributors to GDP, the EPZ registered a growth of 7.0 per cent with exports totalling Rs23.0 billion as compared to Rs21.0 billion a year earlier. EPZ exports are expected to increase further to Rs29.0 billion in 1999. The tourism sector grew by 6.0 per cent in 1998 with tourist arrivals going up by 4.1 per cent to 558,195. Gross foreign exchange earnings from this sector, however, grew at a higher rate of 18.1 per cent as compared to 11.3 per cent in 1997.
Aggregate consumption expenditure went up in nominal terms by 11.5 per cent in 1998. Adjusted for price increases, the growth rate worked out to 4.4 per cent. Gross Domestic Savings (GDS), which is the difference between GDP and aggregate consumption expenditure, registered a growth rate of 16.0 per cent in 1998 as compared to 13.0 per cent in 1997. The savings rate, defined as the ratio of GDS to GDP at market prices, went up from 24.3 per cent in 1997 to 25.1 per cent in 1998 but is expected to recede to 23.3 per cent in 1999.
Gross Domestic Fixed Capital Formation (GDFCF) increased in nominal terms by 10.7 per cent in 1998, exclusive of the purchase of aircraft and marine vessel. In real terms, GDFCF increased by 5.6 per cent in 1998 and is expected to further pick up by 7.1 per cent in 1999. The ratio of GDFCF to GDP at market prices fell from 27.2 per cent in 1997 to 23.2 per cent in 1998 but is expected to pick up to 26.5 per cent in 1998.
The population of the Republic of Mauritius was estimated at 1,167,445 at the end of December 1998. The total labour force increased by 2.4 per cent to 517,000 in 1998. Employment, inclusive of foreign workers, was estimated to have risen by 2.5 per cent to 487,600 in 1998. The unemployment rate, which had been on a rising trend since 1991, declined by 0.1 percentage point to 5.8 per cent in 1998.
Reflecting the high rate of monetary expansion in the previous fiscal year, the salary increases stemming from the implementation of the public sector pay award, the introduction of the value-added tax in September 1998, the drought conditions that have prevailed since the end of 1998 and the lagged impact of the depreciation of the rupee, the rate of inflation for the fiscal year 1998-99, as measured by the average change in the Consumer Price Index (CPI), increased to 7.9 per cent from 5.4 per cent in 1997-98.
The basic thrust of monetary policy in 1998-99 continued to be directed towards the achievement of price stability and a stable exchange rate of the rupee, in the context of a broad interplay of market forces in the determination of interest and exchange rates. The Bank of Mauritius continued to use the Reserve Money Programme (RMP) and the liquidity forecasting framework as a basis for intervening in the money and foreign exchange markets. As part of the ongoing process of financial liberalisation, the cash ratio was brought down from 6.0 to 5.5 per cent while the non-cash liquid assets ratio remained at zero per cent. The tight monetary policy stance of 1998-99 was reflected in a general rise in interest rates. In spite of the higher inflation rate during fiscal year 1998-99, the real rate of interest remained positive. The auctioning of Treasury Bills of maturities of 30 days and 728 days provided financial institutions with additional investment opportunities. The launching of the over the counter market for Government of Mauritius Treasury Bills in December 1998 helped to enhance public awareness and investment culture in these Bills.
Aggregate monetary resources, that is, money supply M2, expanded by 13.2 per cent in 1998-99 as compared to an increase of 17.4 per cent in 1997-98. Net foreign assets of the banking system went up by 4.6 per cent, from Rs21,118 million at the end of June 1998 to Rs22,087 million at the end of June 1999, reflecting increases in the net foreign assets of both the Bank of Mauritius and commercial banks. Growth of domestic credit slowed down to 13.0 per cent in 1998-99 from a growth of 26.1 per cent recorded in the preceding year. Credit to the private sector expanded by 20.4 per cent in 1998-99 down from an increase of 32.3 per cent in 1997-98. However, net credit to Government by the banking system declined for the first time in four years.
The overall budget deficit for 1998-99 was Rs3,650 million, equivalent to 3.6 per cent of GDP as against to 3.7 per cent in 1997-98. Higher revenue was generated through the replacement of the sales tax of 8 per cent by a value-added tax of 10 per cent that covers a broader range of goods and services as well as through the increased buoyancy of tax revenue. Government efforts to curtail the growth of expenditure were partly mitigated by the salary increases stemming from the implementation of the public sector pay award. The budget deficit was financed exclusively from domestic sources, namely by the non-bank sector and the Bank of Mauritius. Total central Government indebtedness reached Rs51,001 million at the end of June 1999, with external and internal debt amounting to Rs10,027 million and Rs40,974 million, respectively. As a percentage of GDP, total central Government debt increased from 49.6 per cent at the end of June 1998 to 50.3 per cent at the end of June 1999. The debt service ratio of the country increased from 6.7 per cent in 1997-98 to 7.9 per cent in 1998-99, largely reflecting the partial redemption of the Floating Rate Note (FRN) in October 1998.
The reorientation of monetary policy towards the end of 1998 brought about a better integration of monetary and exchange rate policy. In that context, greater stability has been imparted to the exchange value of the rupee whilst also enhancing the attractiveness of rupee-denominated assets.
The current account of the balance of payments registered a deficit of Rs1,977 million in 1998-99 as compared to a deficit of Rs2,704 million in 1997-98. In relation to GDP, the deficit on the current account represented 1.9 per cent in 1998-99 as compared to a deficit of 3.0 per cent in 1997-98. This improvement in the current account of the balance of payments stemmed essentially from an increase in the surplus registered on the services account, from Rs4,364 million in 1997-98 to Rs5,681 million in 1998-99. Excluding the import of aircraft, the current account of the balance of payments recorded a surplus of Rs773 million in 1998-99, equivalent to 0.8 per cent of GDP. Exports, f.o.b., rose by 9.8 per cent to Rs39,732 million while imports, f.o.b., went up by 8.0 per cent to Rs49,189 million in 1998-99. The capital and financial account recorded a net inflow of Rs668 million in 1998-99.
Net international reserves of the country, made up of the net foreign assets of the banking system, the foreign assets of Government and Mauritius' Reserve position in the International Monetary Fund (IMF), increased from Rs21,349 million at the end of June 1998 to Rs22,575 million at the end of June 1999. Net international reserves, which provide a more comprehensive measure of import cover than the foreign reserves of the Bank of Mauritius alone, represented 5.4 months of imports, exclusive of the purchase of aircraft, at the end of June 1999 as compared to 5.5 months at the end of June 1998.
The foregoing economic and financial developments during the year 1998-99 are reviewed in greater details in the following chapters of the report.
|
I. NATIONAL INCOME AND PRODUCTION |
In 1998, the economy maintained its growth momentum, expanding by 5.2 per cent as compared to the annual average growth rate of 5.5 per cent over the period 1990 to 1997. Economic activity was largely driven by the strong performance of the export sector, supported by growth in our major export markets, namely the European Union and the United States. In real terms, exports of goods and non-factor services went up by a higher rate of 11.1 per cent in 1998 as compared to 4.0 per cent a year earlier. In contrast, the expansion of real aggregate domestic demand fell from 9.9 per cent in 1997 to 0.2 per cent in 1998, largely due to a drop in gross capital formation in real terms.
Nominal GDP at factor cost rose by Rs9,420 million, from Rs75,019 million in 1997 to Rs84,439 million in 1998. Per capita GNP at market prices went up from Rs74,655 in 1997 to Rs83,027 in 1998. However, on account of the appreciation of the dollar vis-à-vis the rupee, it declined from US$3,525 in 1997 to US$3,441 in 1998.
Aggregate Consumption Expenditure
Aggregate consumption expenditure expanded, in real terms, by 4.4 per cent for the second year in a row. Consumption expenditure of households grew by 4.6 per cent in 1998; that of general government went up by 3.6 per cent in 1998, higher than the increase of 3.5 per cent in 1997. Nominal aggregate consumption expenditure fell from 75.7 per cent of GDP in 1997 to 74.9 per cent in 1998. The ratio of household consumption expenditure to GDP declined from 63.8 per cent in 1997 to 63.0 per cent in 1998 while the ratio of general government consumption to GDP remained stable at 11.9 per cent.
Table I.1 shows the main national accounting aggregates and ratios from 1996 to 1999.
Table I.1: Main National Accounting Aggregates and Ratios
1
Revised estimates. 2 Preliminary estimates. 3 First forecast.Source: Central Statistical Office, Government of Mauritius.
Gross Domestic Fixed Capital Formation (GDFCF)
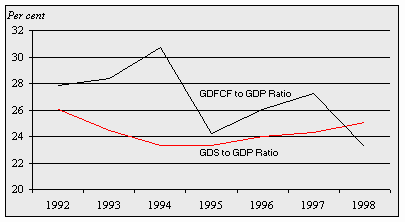
Gross Domestic Fixed Capital Formation (GDFCF) contracted, in real terms, by 7.5 per cent in 1998 after expanding by 10.8 per cent in 1997. The GDFCF to GDP ratio went down from 27.2 per cent in 1997 to 23.2 per cent for the year under review. Excluding irregular investments, namely the purchase of aircraft and marine vessel, a different picture emerged with GDFCF rising by 5.6 per cent in 1998 as against a contraction of 1.5 per cent a year earlier. The share of private sector GDFCF in total GDFCF, exclusive of the purchase of aircraft and marine vessel, remained virtually unchanged at around 72.4 per cent in 1998.
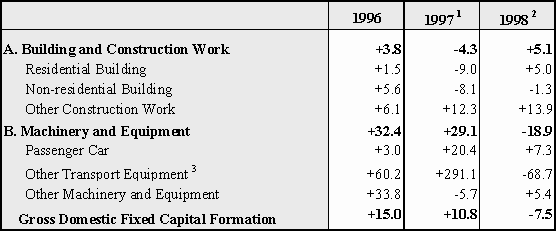
Reflecting the strong performance of the construction sector in 1998, GDFCF in "Building and Construction Work" recovered markedly in 1998, expanding, in real terms, by 5.1 per cent as against a contraction of 4.3 per cent in the preceding year. Investment in "Residential Building" was up, in real terms, by 5.0 per cent in 1998, contrasting with the decline of 9.0 per cent registered in 1997. Easier credit terms on mortgage finance coupled with Government policy to encourage investment in low-cost housing for low-income groups were the main factors driving capital formation in "Residential Building". However, investment in "Non-residential Building", essentially industrial building, fell for the second consecutive year while investment in "Other Construction Work" was sustained with a real growth of 13.9 per cent in 1998 as compared to 12.3 per cent a year earlier. Government capital expenditure on public works with a view to upgrading existing public infrastructure was a contributory factor explaining the recovery in the construction sector.
Investment in "Machinery and Equipment" contracted, in real terms, by 18.9 per cent in 1998 in contrast to an expansion of 29.1 per cent in the preceding year. However, exclusive of the purchase of aircraft and marine vessel, both "Other Transport Equipment" and "Other Machinery and Equipment" registered positive real growth rates. Investment in "Passenger Car" maintained its upward trend in 1998, increasing in real terms by 7.3 per cent in 1998 as compared to 20.4 per cent in the preceding year.
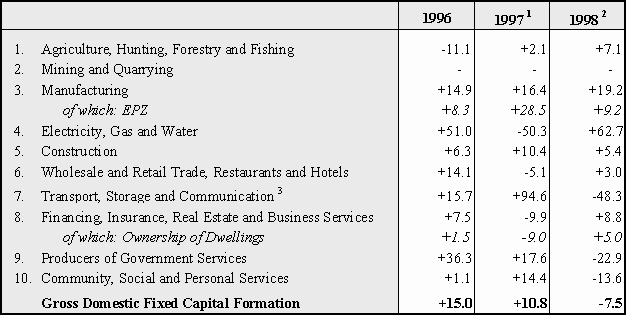
An analysis of investment by industrial use showed that investment in "Manufacturing" increased further in 1998 with a real growth of 19.2 per cent, higher than that of 16.4 per cent in 1997. Capital formation in the EPZ grew by 9.2 per cent in 1998 as compared to a higher rate of expansion of 28.5 per cent in the preceding year. Investment in the highly capital-intensive "Electricity, Gas and Water" sector was significant in 1998 after a sharp decline in the preceding year. The share of investment in "Financing, Insurance, Real Estate and Business Services" in total GDFCF was highest at 27.6 per cent in 1998 followed by "Manufacturing" with a share of 18.7 per cent.
Tables I.2 and I.3 show the growth of GDFCF by type of capital goods and by industrial use in real terms, respectively, for the period 1996 through 1998. Chart I.1 depicts movements in the ratio of GDFCF and Gross Domestic Savings (GDS) to GDP at market prices for the years 1992 through 1998.
Table I.2: Real Growth Rates of GDFCF by Type of Capital Goods
(Per cent)
1
Revised estimates. 2 Preliminary estimates.3
Inclusive of the purchase of aircraft and marine vessel.Source: Central Statistical Office, Government of Mauritius.
Table I.3: Real Growth Rates of GDFCF by Industrial Use
(Per cent)
1
Revised estimates. 2 Preliminary estimates.3
Inclusive of the purchase of aircraft and marine vessel.Source: Central Statistical Office, Government of Mauritius.
Chart I.1: Ratio of GDFCF and GDS to GDP at market prices
Source: Central Statistical Office, Government of Mauritius.
National Disposable Income, National Savings and Resource Balance
Gross National Disposable Income (GNDI) registered a nominal growth of 12.1 per cent in 1998 while nominal consumption expanded by 11.5 per cent. Consequently, the Gross National Savings (GNS) to GNP ratio rose from 26.8 per cent in 1997 to 27.1 per cent in 1998. Similarly, the ratio of GDS to GDP at market prices went up from 24.3 per cent in 1997 to 25.1 per cent for the year under review. As a percentage of GDP at market prices, the Resource Balance (defined as Savings minus Investment) improved to 0.2 per cent in 1998 as against -4.9 per cent in 1997.
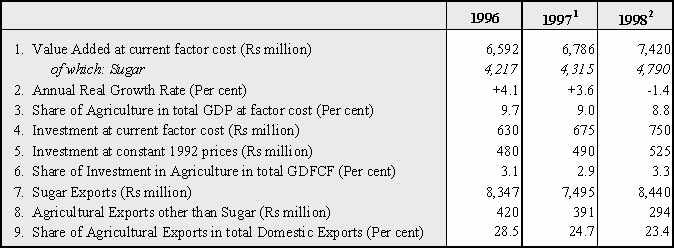
Unfavourable climatic conditions affected the output of the agricultural sector which declined, in real terms, by 1.4 per cent in 1998. Sugarcane, which accounted for 64.6 per cent of the agricultural sector, was relatively least affected by climatic conditions with output marginally up by 1.0 per cent in 1998, while non-sugar agricultural output dropped by 5.0 per cent. Although value added by the agricultural sector went up in nominal terms by 9.3 per cent in 1998, the share of this sector in the economy fell from 9.0 per cent in 1997 to 8.8 per cent in the year under review.
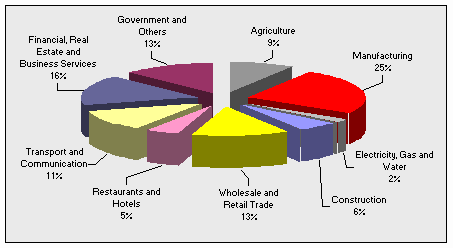
Table I.4 shows the main aggregates of the agricultural sector for the years 1996 through 1998. Chart I.2 shows the sectoral distribution of GDP at factor cost for 1998.
Table I.4: Main Aggregates of the Agricultural Sector
1
Revised estimates. 2 Preliminary estimates.Source: Central Statistical Office, Government of Mauritius.
Chart I.2: Sectoral Distribution of GDP in 1998
Source: Central Statistical Office, Government of Mauritius.
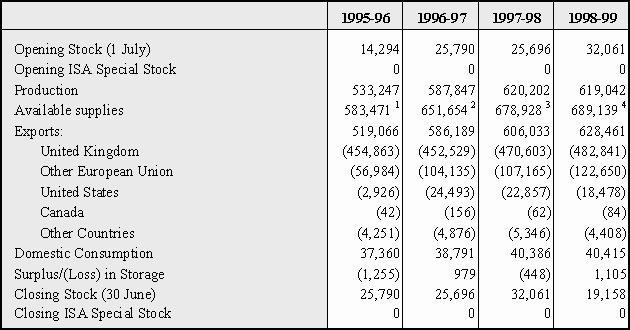
Sugarcane production grew, in real terms, by 1.0 per cent in 1998 as compared to 5.5 per cent in the preceding year. Sugar output registered a six-year record high of 628,588 tonnes for the year under review. The extraction rate improved from 10.73 per cent in 1997 to 10.88 per cent in 1998. However, the yield per hectare fell from 79.54 per cent to 78.09 per cent over the same period. There was a reversal of the declining trend in land acreage under sugarcane cultivation observed in recent years. Land area under sugarcane cultivation went up from 72,758 hectares in 1997 to 74,028 hectares in 1998 following the ongoing conversion of land formerly under tea cultivation.
Table I.5 shows the trend in sugar production and exports for the years 1995-96 through 1998-99.
Table I.5: Trend in Sugar Production and Exports
(Tonnes Tel Quel)
1
Include 35,930 tonnes of imported sugar.2
Include 38,017 tonnes of imported sugar.3
Include 33,030 tonnes of imported sugar.4
Include 38,036 tonnes of imported sugar.Note: The above figures refer to fiscal years, which extend from July to June, and not to crop years which extend from June to May.
Source: Mauritius Sugar News Bulletin, The Mauritius Chamber of Agriculture.
Production of sugar for the fiscal year 1998-99 amounted to 619,042 tonnes while 628,461 tonnes were exported. Of these, 605,491 tonnes or 96.3 per cent were destined to the European Union (EU) under the Sugar Protocol and the Special Sugar Preferential Agreement. Exports to the United States amounted to 18,478 tonnes while domestic consumption stood at 40,415 tonnes for the fiscal year 1998-99. Mauritius exported seven types of Refined Sugars, for which there is an increased demand in Europe.
Sugar exports, with a share of 22.6 per cent in total domestic exports, registered a nominal rise of 12.6 per cent in 1998. Export receipts from cane molasses, one of the by-products of the sugar industry, went down from Rs102 million in 1997 to Rs70 million in 1998. A positive development in 1998 was the higher production of electricity generated from bagasse, another by-product of the sugar industry.
Although value added by the non-sugar agricultural sector rose in nominal terms from Rs2,471 million in 1997 to Rs2,630 million in 1998, its share in the agricultural sector went down from 36.4 per cent to 35.4 per cent over the same period. In real terms, non-sugar agricultural production contracted by 5.0 per cent, largely on account of the drought that started in the last quarter of 1998, as against a positive growth of 1.0 per cent in 1997.
While the area under tea and tobacco cultivation declined by 10.3 per cent and 7.1 per cent, respectively, the area under foodcrop cultivation registered an increase of 1.2 per cent in 1998. However, total foodcrop production declined by 9.7 per cent from 101,442 tonnes in 1997 to 91,618 tonnes for the year under review. Exports of cut flowers and foliage fell both in value and volume terms from Rs123 million and 576 tonnes, respectively, in 1997 to Rs112 million and 457 tonnes in 1998. A large contraction was recorded in the exports of wheaten flour which fell by Rs53 million to Rs102 million in 1998. Exports of live animals grew in nominal terms from Rs74 million in 1997 to Rs87 million in 1998. The production and exports of tea shrank in 1998, reflecting Government policy to divert resources from this low profitability sector to higher value added sectors.
The expansion of the manufacturing sector was sustained in 1998 with a growth of 6.3 per cent as compared to 5.8 per cent in 1997. Its share in GDP at factor cost rose from 24.4 per cent in 1997 to 24.8 per cent in 1998. The growth of the manufacturing sector was mainly driven by the improved performance of the EPZ. Investment in the manufacturing sector was maintained with a real expansion of 19.2 per cent in 1998 as compared to 16.4 per cent a year earlier.
Table I.6 shows the main aggregates of the manufacturing sector for the period 1996 through 1998.
Table I.6: Main Aggregates of the Manufacturing Sector

1
Revised estimates. 2 Preliminary estimates.Source: Central Statistical Office, Government of Mauritius.
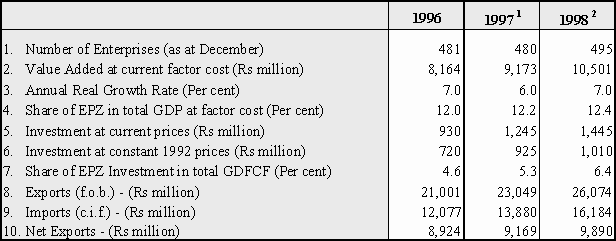
Value added by the EPZ, the largest sub-sector of the manufacturing sector, was estimated at Rs10,501 million in 1998. Real growth of the EPZ was higher at 7.0 per cent in 1998 as compared to 6.0 per cent a year earlier. EPZ exports increased in nominal terms by 13.1 per cent, from Rs23,049 million in 1997 to Rs26,074 million in 1998, thus maintaining its position as the largest generator of gross foreign exchange earnings. EPZ imports grew in nominal terms at a higher rate of 16.6 per cent, from Rs13,880 million in 1997 to Rs16,184 million in 1998, reflecting the high import content of EPZ exports. Around 91 per cent of EPZ imports consisted of raw material imports while the import of machinery and equipment constituted the remaining 9 per cent. In nominal terms, net EPZ exports grew by 7.9 per cent to Rs9,890 million in 1998 as compared to a growth of 2.7 per cent in 1997.
The commodity-wise distribution of EPZ exports showed that the EPZ remained overwhelmingly dependent on the export of articles of apparel and clothing. This dependence further increased in 1998 with articles of apparel and clothing constituting 81.3 per cent of total EPZ exports as compared to 78.7 per cent in 1997. However, the distribution of EPZ exports by country of destination indicated a marked change in 1998. EPZ exports to the U.S. increased in nominal terms by 39.0 per cent in 1998, accounting for 56.1 per cent of the total increase in EPZ exports. Thus, the U.S. became the second largest market for EPZ exports after France. Exports to the EU increased by 8.5 per cent in 1998.
A positive development in 1998 was the sustained expansion of the non-EPZ and non-sugar milling activity in the manufacturing sector, which grew by 5.9 per cent in 1998 from 5.4 per cent in 1997. This was due to a marked shift in the marketing strategy of this sector, which has in recent years taken increasing advantage of Government foreign policy to foster regional economic co-operation and tap new export markets. This has created opportunities for firms that were producing for the domestic market to expand their businesses and export to regional markets. Exports to Common Market for Eastern and Southern Africa (COMESA) member states grew in nominal terms by 22.5 per cent in 1998.
Furthermore, Government policy to encourage small businesses, namely Small and Medium Enterprises (SMEs), micro-enterprises and Pioneer Status Enterprises, to expand their businesses has also started to yield positive results. SMEs, in particular, benefit from a wide range of support services and assistance programmes as well as soft loans from the Development Bank of Mauritius (DBM). The number of Pioneer Status Enterprises, which regroup enterprises engaged in the manufacture of high value added products, increased by 39 to 195 in 1998 while employment in such enterprises rose to 2,481 in December 1998 from 2,252 in December 1997.
Table I.7 shows the main aggregates of the EPZ for the period 1996 through 1998.
Table I.7: Main Aggregates of the EPZ
1
Revised estimates. 2 Estimates.Source: Central Statistical Office, Government of Mauritius.
The tourism sector registered a growth of 6.0 per cent in 1998 as compared to 10.2 per cent a year earlier. Tourist receipts rose from Rs10,068 million in 1997 to Rs11,890 million in 1998, representing a growth of 18.1 per cent, which compared favourably with that of 11.3 per cent registered in 1997. Tourist arrivals went up from 536,125 in 1997 to 558,195 in 1998, showing a growth of 4.1 per cent as compared to 10.1 per cent in 1997. Nearly 92 per cent of the tourists coming to Mauritius in 1998 did so for holidaying.
Tourist arrivals from our traditional source markets in Europe remained on average on an uptrend, growing by 8.0 per cent to 352,530 in 1998. Tourist arrivals from the core source markets in Europe, namely France, United Kingdom, Germany and Italy, witnessed diverging trends. In 1998, tourist arrivals from France and the United Kingdom recorded relatively high growth of 12.1 per cent and 13.6 per cent, respectively. Tourist arrivals from Italy increased by 3.9 per cent while arrivals from Germany declined, albeit marginally, by 0.4 per cent. Tourist arrivals from Asian countries, which were rapidly expanding prior to the Asian crisis, fell by 9.4 per cent in 1998 with the highest decline for Hong Kong (-40.5 per cent), followed by Malaysia (-29.0 per cent) and Japan (-20.2 per cent). Tourist arrivals from South Africa also fell by 3.1 per cent in 1998. A positive development was the increase in the number of arrivals from the United States.
On the supply side, there were a number of significant developments. Registered hotels, which numbered 87 at the end of December 1997, rose to 90 at the end of December 1998. Furthermore, a number of existing hotels carried out major renovation works and upgraded existing facilities with a view to moving up-market and therefore generating higher value added. The number of rooms and bedplaces also rose to reach 7,267 and 14,995, respectively, in 1998 as compared to 6,809 and 14,126 in 1997. While the monthly room occupancy rate of all registered hotels remained unchanged at 72 per cent in 1998, that of "large" hotels fell marginally by 1 per cent to 77 per cent for the period under review.
Direct employment in the tourist industry, which includes employment in restaurants, hotels and travel and tourism, was sustained at an annual average growth of 4.8 per cent between 1994 and 1998, reaching 16,490 for the year under review. However, given the linkages with the rest of the economy, it is estimated that indirect employment created by the tourist industry is around 35,000, which would therefore bring total employment in this sector to over 50,000 in 1998.
Financial and Business Services
The "Financing, Insurance, Real Estate and Business Services" sector grew by 6.6 per cent in 1998, higher than the annual average rate of 6.5 per cent between 1995 and 1997. It contributed about 16.4 per cent to GDP in 1998, driven mainly by "Financial Institutions" and "Insurance and Other Business Services", the value added of which are estimated at Rs5,111 million and Rs4,662 million, respectively, for the year under review. The financial sector is expected to gain further momentum with the introduction of the Financial Services Authority Bill and the Anti-Money Laundering and Economic Crime Bill due to be enacted in the fiscal year 1999-00.
Economic activity in the Freeport sector remained buoyant with total turnover rising by 65.0 per cent in 1998 to Rs7,461 million as compared to Rs4,522 million a year earlier. This was largely attributable to the capacity build-up as a result of massive investment carried out during the last two years. With the expansion in regional trade, largely with COMESA and Southern African Development Community (SADC) member states, and the policy to position Mauritius as a gateway between Asia and Africa, economic activity in the Freeport zone is expected to gain further momentum.
The "Construction" sector rebounded in 1998 with a growth of 6.0 per cent as against a contraction of 1.0 per cent a year earlier as a result of the launching of several major infrastructure projects. Although "Transport, Storage and Communication" remained buoyant in 1998, growth in that sector fell to 6.5 per cent in 1998 as compared to 7.6 per cent in 1997. "Producers of Government Services" grew at a higher rate of 4.0 per cent during the year under review as compared to 3.5 per cent in 1997. "Community, Social and Personal Services" expanded by 4.5 per cent in 1998 as compared to 4.7 per cent in the preceding year. Drought conditions caused the "Electricity, Gas and Water" sector to grow a slower rate of 6.0 per cent in 1998 as compared to 8.7 per cent in 1997.
Due to the persistent drought conditions affecting the agricultural sector in particular, economic growth is forecast at 3.0 per cent in 1999. Agricultural output is expected to fall by 24.6 per cent in 1999 with "Sugarcane" estimated to contract by 37.0 per cent. However, the deceleration in agricultural output is likely to be offset by strong growth in other key sectors of the economy, namely the EPZ and the tourist industry. Excluding the sugar sector, the economy would register a growth of 5.6 per cent in 1999. Aggregate consumption expenditure is forecast to grow by 4.3 per cent in 1999 while the savings rate is expected to go down to 23.3 per cent, largely due to the fall in national disposable income. The GDFCF to GDP ratio would remain strong at 26.5 per cent in 1999 inclusive of the purchase of aircraft. Exclusive of the purchase of aircraft, real domestic demand is estimated to grow at a higher rate of 3.7 per cent in 1999.
|
II LABOUR MARKET AND PRICE DEVELOPMENTS |
The implementation of the Pay Research Bureau (PRB) salary award in September 1998 and the across-the-board wage compensation for the rise in the cost of living are estimated to have cost around Rs2.5 billion to the whole economy during 1998-99. This increase in total wage bill generated additional wage pressures in the economy with a negative impact on labour costs.
On the positive side, job creation continued in expanding sectors of the economy, resulting in a decline in the unemployment rate.
The promotion of productivity growth is continuously being emphasised. The National Productivity and Competitiveness Council has been set up to promote total factor productivity in the economy. Gains are expected to arise from factors such as product enhancement and greater efficiency through training and better management.
Compensation of employees increased at a higher rate of 13.2 per cent in 1998 as compared to 9.2 per cent in 1997, reflecting to a large extent the combined effect of the payment of wage compensation for the rise in the cost of living and of the salary award in the public sector following the implementation of the PRB Report in September 1998. The growth of compensation of employees was highest in the general Government sector with a rise of 13.7 per cent in 1998 as compared to 8.1 per cent a year earlier, while for the rest of the economy it went up by 13.0 per cent from 9.6 per cent in the preceding year.
Adjusted for the increase in the price level of 6.8 per cent for 1998, compensation of employees rose by 6.0 per cent, outpacing the real growth rate of GDP of 5.2 per cent. Wage increases in excess of real output gains are a potential source of inflationary pressure.
In the fiscal year 1998-99, compensation for the rise in the cost of living in respect of employees whose basic wage was Rs2,700 or less per month was 6.0 per cent, which was higher than the inflation rate of 5.4 per cent for 1997-98. Employees earning over Rs2,700 per month were granted a compensation ranging from Rs165 to Rs195, depending on their income bracket. This salary compensation contributed to raise the wage bill for the economy by an estimated amount of Rs1,245 million for 1998-99.
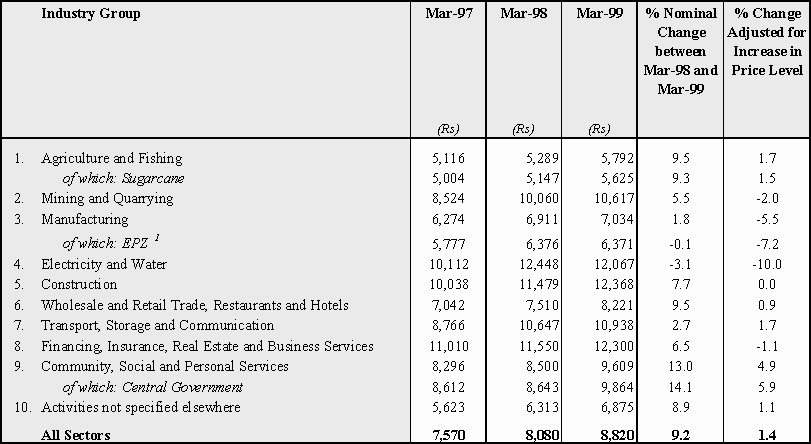
According to the Survey on Employment and Earnings in "large" establishments carried out by the Central Statistical Office (C.S.O.) in March 1999, the average monthly earnings for employees on monthly rates of pay for all industrial groups rose by 9.2 per cent between March 1998 and March 1999 as compared to 6.7 per cent between March 1997 and March 1998. Adjusted for the twelve-month running inflation rate, average monthly earnings for all industrial groups went up by 1.4 per cent between March 1998 and March 1999.
A distribution of average monthly earnings by industry group indicated that the rate of increase in average earnings between March 1998 and March 1999 varied widely across industries. Average monthly earnings in "Community, Social and Personal Services" recorded the highest nominal growth of 13.0 per cent. "Wholesale and Retail Trade, Restaurants and Hotels" and "Agriculture and Fishing" recorded each an increase in average monthly earnings of 9.5 per cent. The lowest increase of 1.8 per cent in average monthly earnings was registered in "Manufacturing".
Table II.1 shows the industry-wise average monthly earnings for employees on monthly rates of pay for the period March 1997 through March 1999.
Table II.1: Average Monthly Earnings for Employees on Monthly Rates of Pay
1
Excluding non-manufacturing EPZ establishments.Source: Central Statistical Office, Government of Mauritius.
The wage rate index measures changes in the price of labour, that is changes over time in remuneration for the same job, and is thus a reliable indicator of wage pressure in the economy. Between September 1997 and September 1998, the overall wage rate index rose by 10.4 per cent as compared to 9.9 per cent between September 1996 and September 1997.
A breakdown of growth in wage rates by industry group showed that the industry-wise picture was uneven. In general, industries that have been recording relatively high real output growth have witnessed relatively low wage increases. Market forces have contributed to restraining wage increases to a large extent while institutional pay review awards that are not linked to productivity gains have put upward pressure on wages. The highest increases in wages between September 1997 and September 1998 were recorded in "Community, Social and Personal Services" and "Electricity and Water" with growth rates of 14.1 per cent and 13.3 per cent, respectively. The "Construction" sector recorded a sharp increase in wages as a result of increasing difficulties in attracting skilled workers to a rapidly expanding industry, which is well-supported by both public and private sectors’ investment in infrastructure building.
In contrast, two sectors, namely "Wholesale and Retail Trade, Restaurants and Hotels", of which tourism is a major component, and "Manufacturing, Mining and Quarrying", which includes the EPZ, recorded moderate wage increases.
Adjusted for the twelve-month running inflation rate, the overall wage rate increased by 4.3 per cent between September 1997 and September 1998 as compared to 2.4 per cent between September 1996 and September 1997. All industry groups, except "Wholesale and Retail Trade, Restaurants and Hotels", registered positive real wage gains.
Table II.2 gives details on the annual percentage change in wage rates by industry group for the period September 1995 through September 1998.
Table II.2: Annual Percentage Change in Wage Rates by Industry Group
(Per cent)

Source: Central Statistical Office, Government of Mauritius.
Labour Force, Employment and Unemployment
The population of the Republic of Mauritius was estimated at 1,167,445 at the end of December 1998. This figure reflects a population growth of 1.0 per cent during the year. The male population was 583,164 and the female population stood at 584,281. The total labour force of 517,000 in 1998, worked out to 44.3 per cent of the population. It showed an increase of 2.4 per cent over the estimated 1997 figure of 504,800.
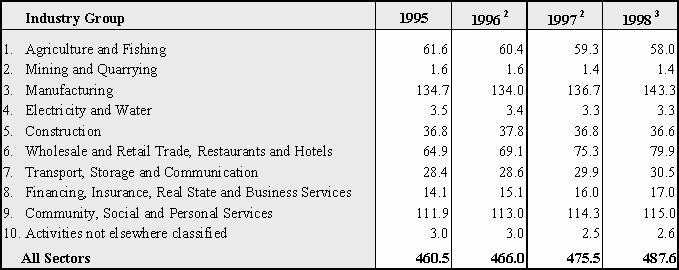
The total number of persons in employment, inclusive of foreign workers, was estimated to have increased by 2.5 per cent to 487,600 in 1998, higher than the 2.0 per cent rise in the preceding year. The increase in employment was mostly generated in the fast expanding industries, namely manufacturing, trade and tourism. Some 6,600 additional jobs were created in the manufacturing sector in 1998, representing over 50 per cent of the increase in employment. Trade and tourism-related sectors accounted for nearly 40 per cent of the increase. Other sectors, with the exception of agriculture and construction, registered marginal increases in employment. In the agricultural sector, job losses were higher in non-sugar activities while employment in the sugar industry was marginally lower in 1998. The manufacturing industry remained the largest employer with a share of 29.4 per cent in total employment in 1998, out of which the EPZ was the single largest employer with a share of 17.5 per cent in total employment. Employment in "Community, Social and Personal Services", which includes central Government workforce, was still on the high side, representing 23.6 per cent of total employment in 1998.
An analysis of the employment data by gender shows that male employment increased by 1.8 per cent, from 322,300 in 1997 to 328,100 in 1998, while female employment increased by 4.1 per cent, from 153,200 to 159,500 over the same period. The number of foreign workers in total employment rose by 1,400 or 16.3 per cent to reach 10,000 in 1998, the increase being exclusively among female workers.
Employment in "large" establishments increased by 2.2 per cent as compared to "other than large" establishments, which registered a rise in employment of 3.0 per cent in 1998.
Table II.3 shows employment by industry group from 1995 to 1998.
Table II.3: Employment by Industry Group 1
(Thousands)
1
Employment figures include foreign workers. 2 Revised. 3 Provisional.Source: Central Statistical Office, Government of Mauritius.
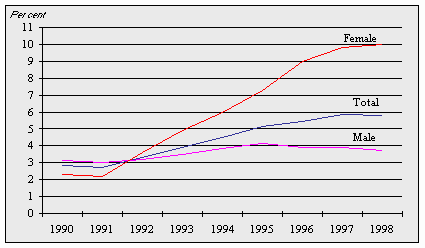
The unemployment rate, which reflected a rising trend since 1991, edged lower from 5.9 per cent in 1997 to 5.8 per cent in 1998. A gender-wise analysis indicated that male unemployment was lower than female unemployment, receding to 3.7 per cent in 1998 from 3.9 per cent in 1997. In contrast, female unemployment went up to 10.0 per cent in 1998. The higher incidence of unemployment on the female labour force indicated that Mauritian female workers were more vulnerable to competition from foreign workers than their male counterparts.
Chart II.1 shows the unemployment rate from 1990 to 1998.
Chart II.1: Unemployment Rate
Source: Central Statistical Office, Government of Mauritius.
Unit Labour Cost and Productivity
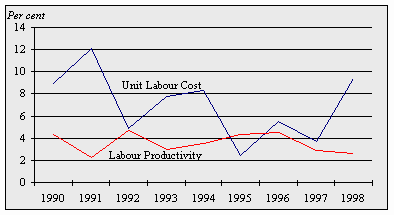
Unit labour cost is defined as the labour cost of producing a unit of output. Changes in unit labour cost are determined by changes in labour productivity and changes in compensation per employee. Unit labour cost is also an important measure of international competitiveness. Unit labour cost grew at a higher rate of 9.4 per cent in 1998 as compared to 3.7 per cent in 1997, well above the annual average growth of 6.3 per cent registered during the period 1990 through 1997.
During 1998, labour productivity, as measured by output per worker, rose by 2.6 per cent as compared to an increase of 2.9 per cent in 1997, which was lower than the annual average growth of 3.6 per cent registered during the period 1990 through 1997. Over the period 1990 through 1998, on an annual average basis, the growth of labour productivity outpaced that of employment.
Unit labour cost and labour productivity exhibited different growth patterns over the period 1990 through 1998, as shown in Chart II.2. The growth of unit labour cost was above that of labour productivity, except in 1995. Unit labour cost in the EPZ recorded an increase of 4.4 per cent in 1998 as compared to 4.6 per cent in 1997. While, over the period 1990 through 1998, unit labour cost in the manufacturing sector increased on average by 5.7 per cent in rupee terms, in U.S. dollar terms, unit labour cost registered a decline of 0.4 per cent.
Chart II.2: Growth Rates of Unit Labour Cost and Labour Productivity
Source: Central Statistical Office, Government of Mauritius.
Consumer price inflation, as measured by the percentage change in the yearly average of the Consumer Price Index (CPI) increased from 5.4 per cent in 1997-98 to 7.9 per cent in 1998-99, marginally lower than the rate of 8 per cent targeted by the Bank of Mauritius. A relatively high rate of monetary expansion in the preceding year, salary increases stemming from the implementation of the Pay Research Bureau (PRB) Report, the introduction of the value-added tax (VAT) in September 1998, drought conditions which prevailed since the end of 1998 and the lagged impact of the depreciation of the rupee, were the major contributory factors to the increase in the inflation rate. The reorientation of monetary policy as from the end of 1998 contributed to greater stability in the exchange value of the rupee. This, along with low world commodity prices and subdued inflation in many of our major trading partner countries, had a positive impact in containing the inflation rate.
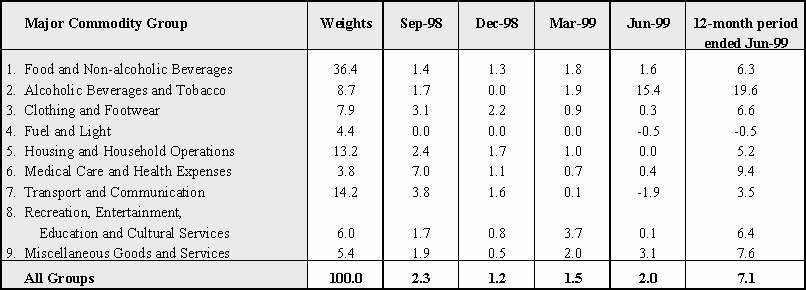
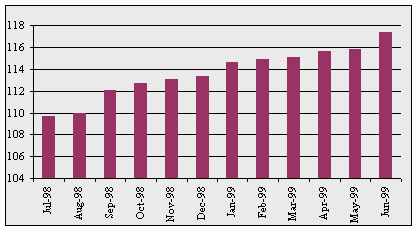
The CPI increased by 7.8 points to 117.4 in the year ended June 1999 as compared to 7.0 points in the previous year. During 1998-99, the major commodity groups in the CPI basket of goods and services recorded increases in the range of 3.5 per cent to 19.6 per cent with the exception of "Fuel and Light" which decreased by 0.5 per cent. The major commodity group "Alcoholic Beverages and Tobacco" registered the highest increase of 19.6 per cent mainly due to increases in excise duties on cigarettes and alcoholic drinks. The major commodity group "Medical Care and Health Expenses" recorded the next highest increase of 9.4 per cent. Some of the increases in the other major commodity groups were due to the application of VAT on goods and services that were initially exempt from sales tax.
Table II.4 shows the quarterly percentage change in the sub-indices of the major commodity groups in the CPI basket of goods and services and Chart II.3 gives the monthly CPI during the fiscal year 1998-99.
Table II.4: Quarterly Percentage Change in the Sub-indices of the CPI by Major Commodity Group
Source: Central Statistical Office, Government of Mauritius.
Chart II.3: Monthly Consumer Price Index (Base year July 1996 - June 1997 = 100)
Source: Central Statistical Office, Government of Mauritius.
Despite upward pressures on prices during 1998-99, the inflation rate was contained within the target of 8 per cent set by the Bank. A restrictive monetary policy will contribute to bringing inflation on a downward path in 1999-00, even though some upside risks to inflation could arise from the global economic recovery and sustained rise in oil prices. Taking these factors into account, the Bank of Mauritius is targeting an inflation rate of 6 per cent for fiscal year 1999-00.